Prior to beginning the map composition you may want to read the following QGIS Page to review some of the key components of a map. The following activity creates a basic map. To read about more advanced map layout options, visit the QGIS manual on the Print Layout.
Activity: Create a Print Map
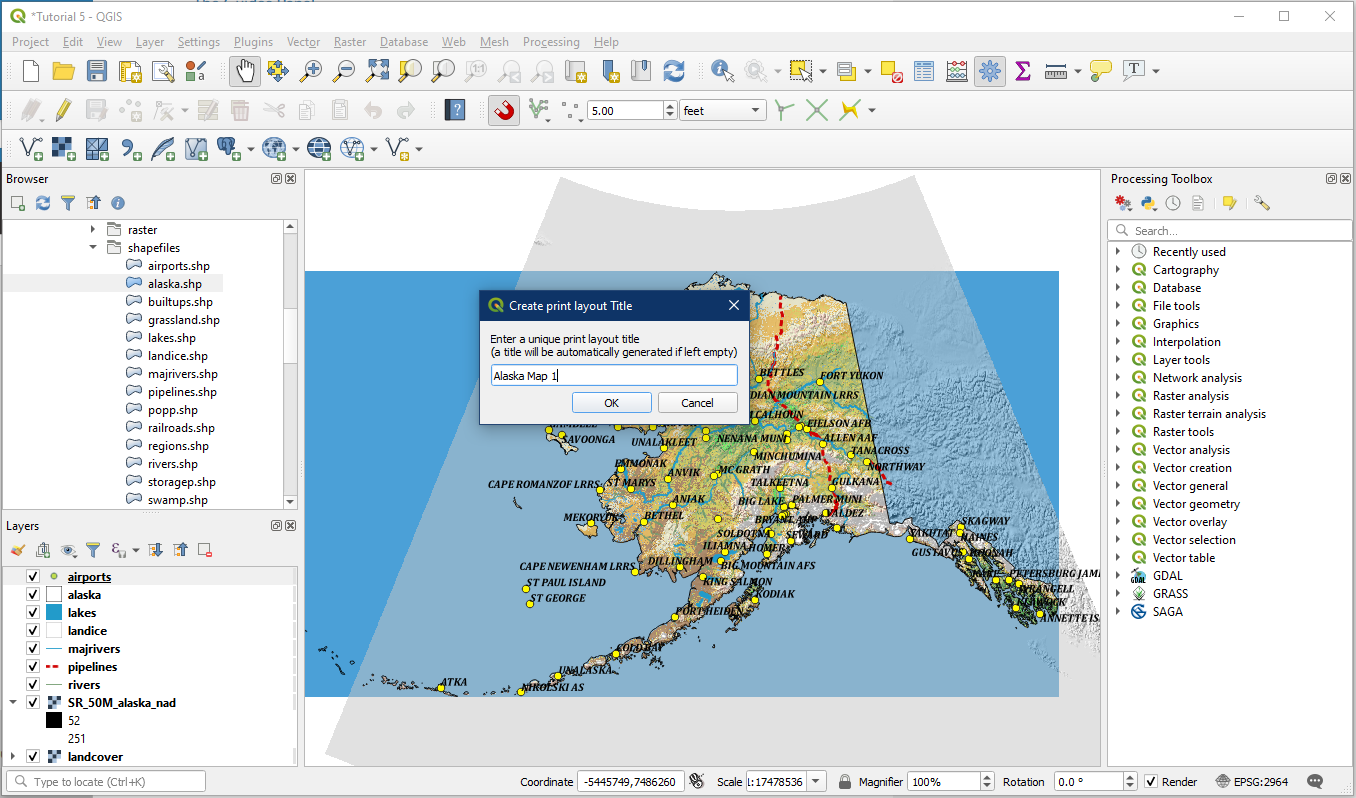
Open QGIS and load the project your project from tutorial 5. We have already modified the symbology of the layer in this project and now want to present it on a map that can be shared or printed. We will need to create a new print layout through the Layout Manager. To do this click Project > New Print Layout. It will ask for a title for this print layout, give it a name e.g. “Alaska Map 1”. Click OK.
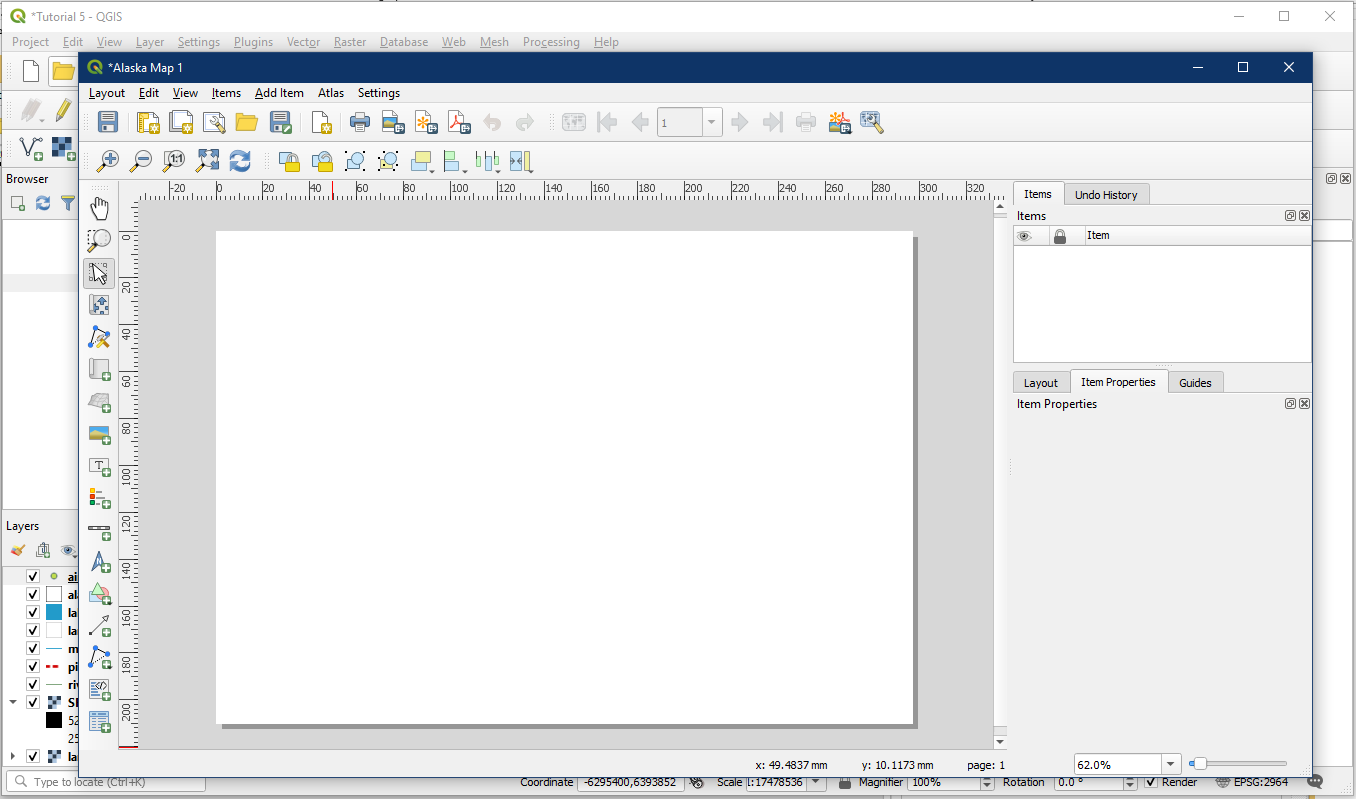
A new window will open with your map name. This is where we will produce the map.
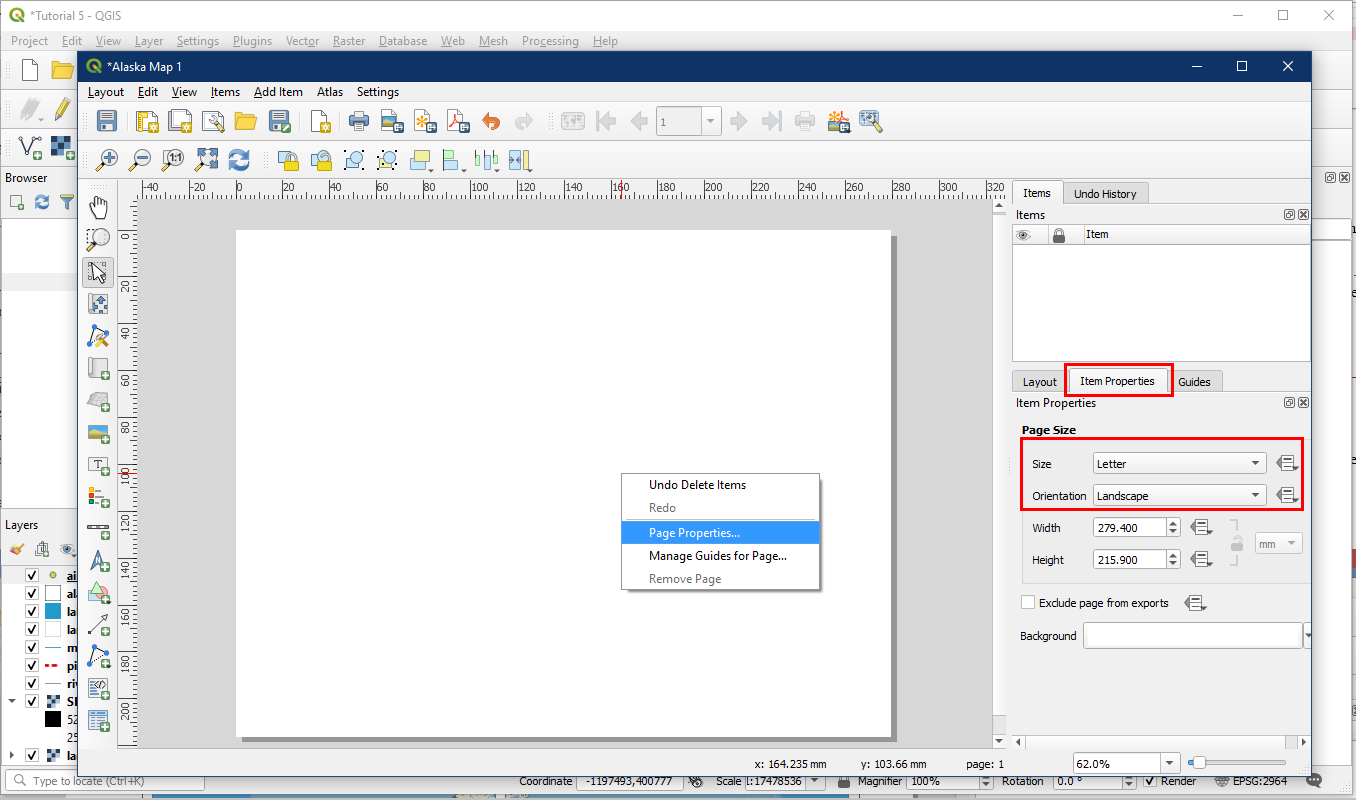
First we will change the page size. The Item Properties tab on the side should show the current page properties. If the Item Properties does not show page properties, right click on the blank page and select Page Properties. Change the page size to Letter and Landscape.
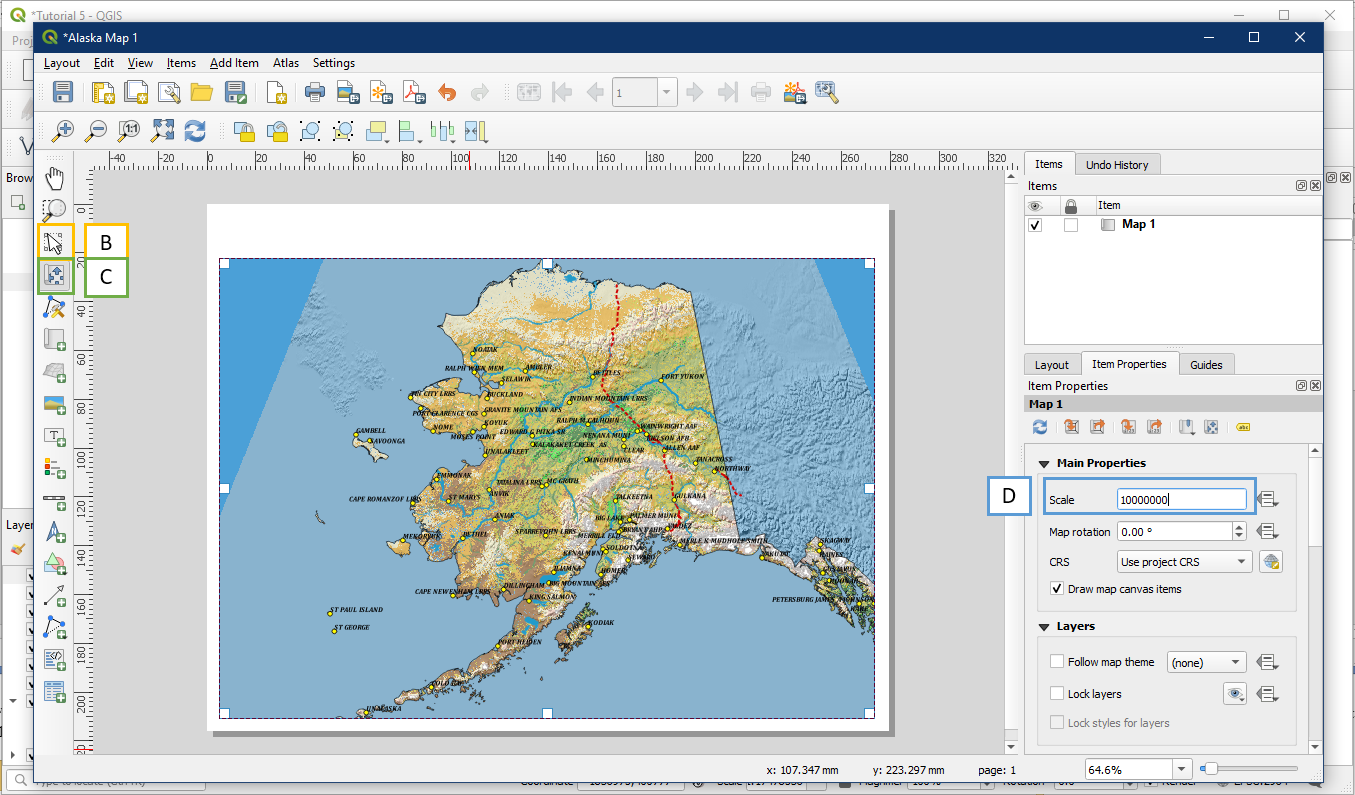
Click the “Add a new Map to the Layout” button (A) and drag a rectangle onto the page. Inside this box the map layers will be displayed. If the box needs to be resized or moved, click the “Select/Move Item” button (B) to select and modify your box.
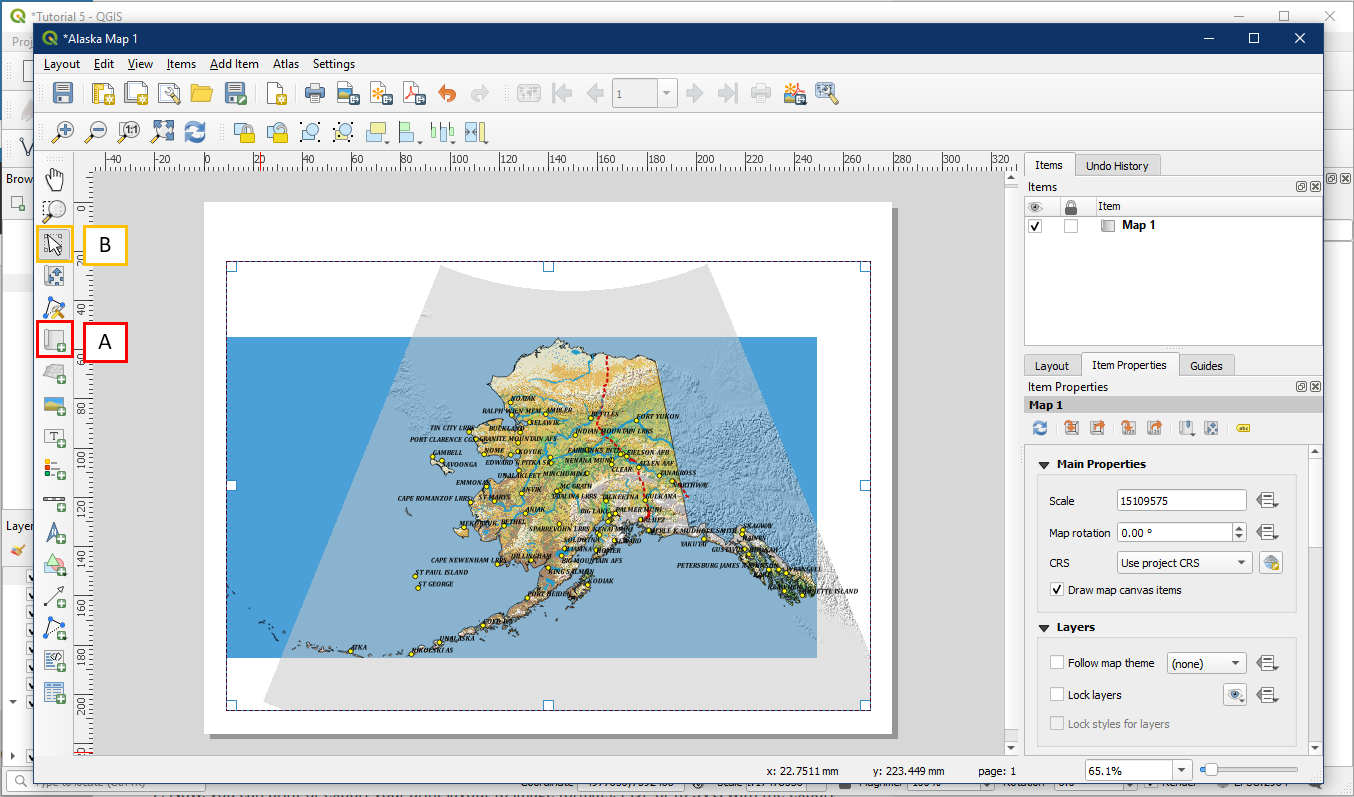
The layers inside the map box will likely be zoomed too far out right now, but we can adjust the view inside the box. First use the Select/Move Item button (B) again to have the map box selected. Then click the Move Item Content button (C) to centre the view of Alaska within the box by dragging with your mouse button within the map panel. Use your mouse scroll wheel or the Scale box under Item Properties (D) to adjust the zoom. A good map scale to use for this map 10000000. Finding the right scale for a map is tricky and often take a lot of adjusting and testing various scale values.
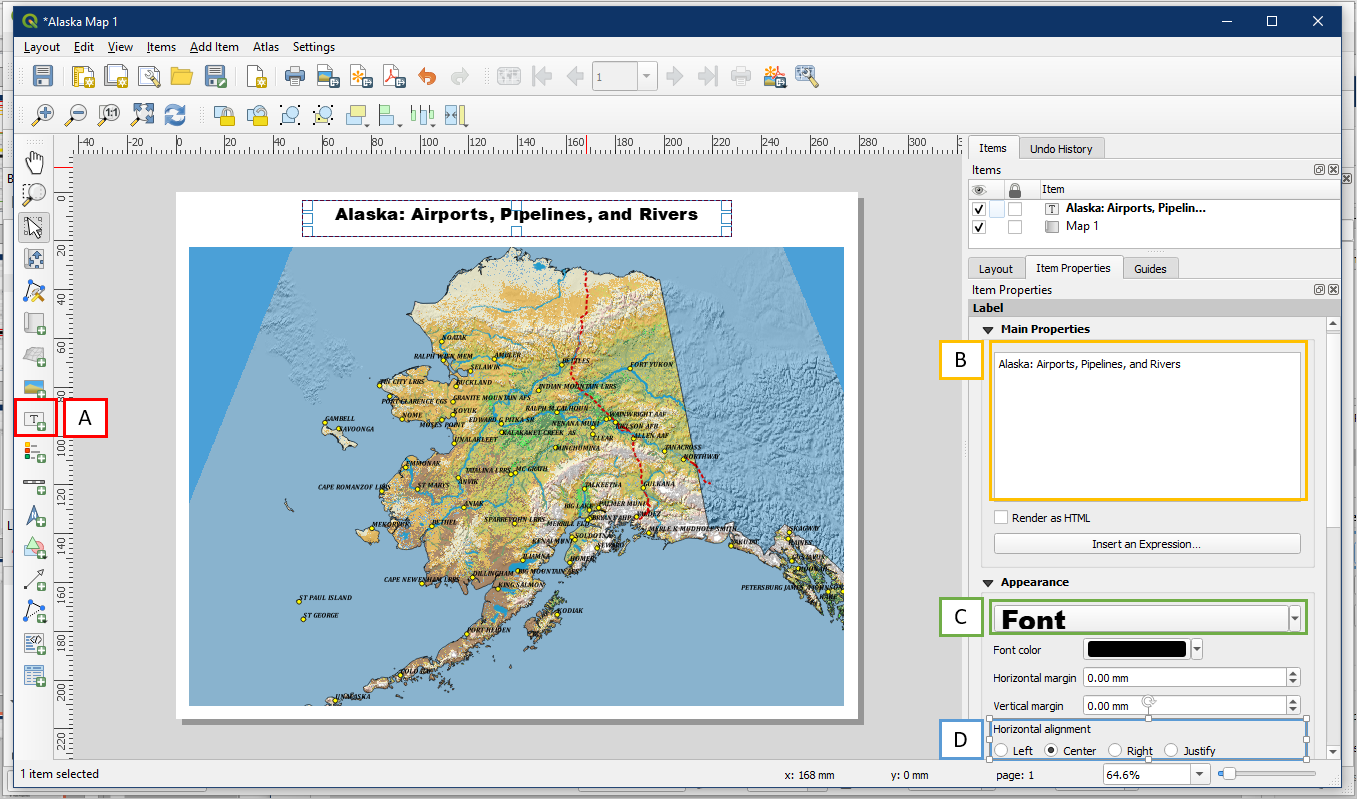
Select the Add New Label button (A) and choose a location for the title of the map. In the Item Properties tab, under Main Properties (B), give the map a title e.g. “Alaska: Airports, Pipelines, and Rivers”. Under Appearance, click the Font button (C) to adjust the font to something large and easy to read, e.g. Arial Black, Size 20. Choose “Center” under Horizontal alignment (D) to center your title in the title box. Note that the Item Properties tab changes based on whichever map element is currently selected.
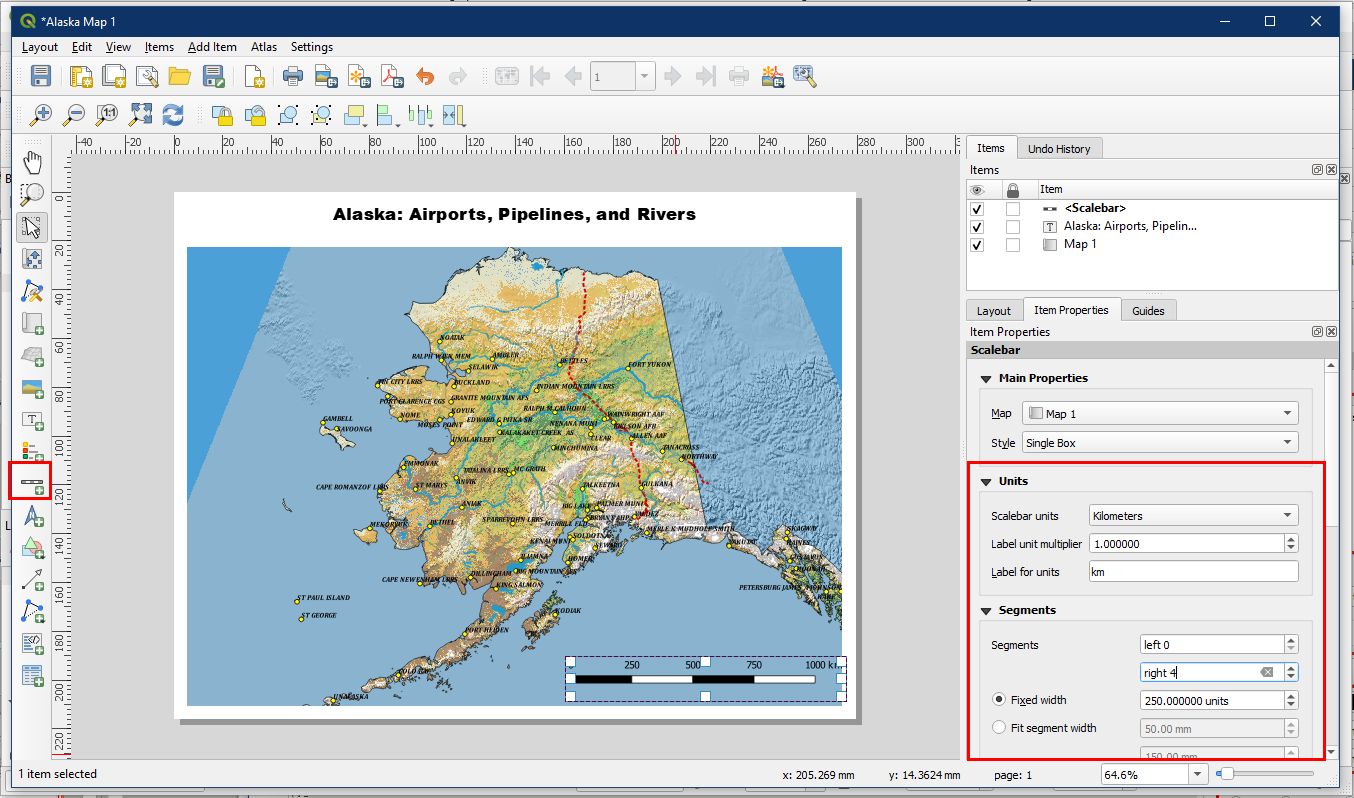
Select the Add scale bar button to draw a scale bar. In the Item Properties table, ensure the Scale bar units is Kilometers. The default scale bar also tends to be very short, so under Segments increase the number of right segments to 4, and set a Fixed width of 250 units.
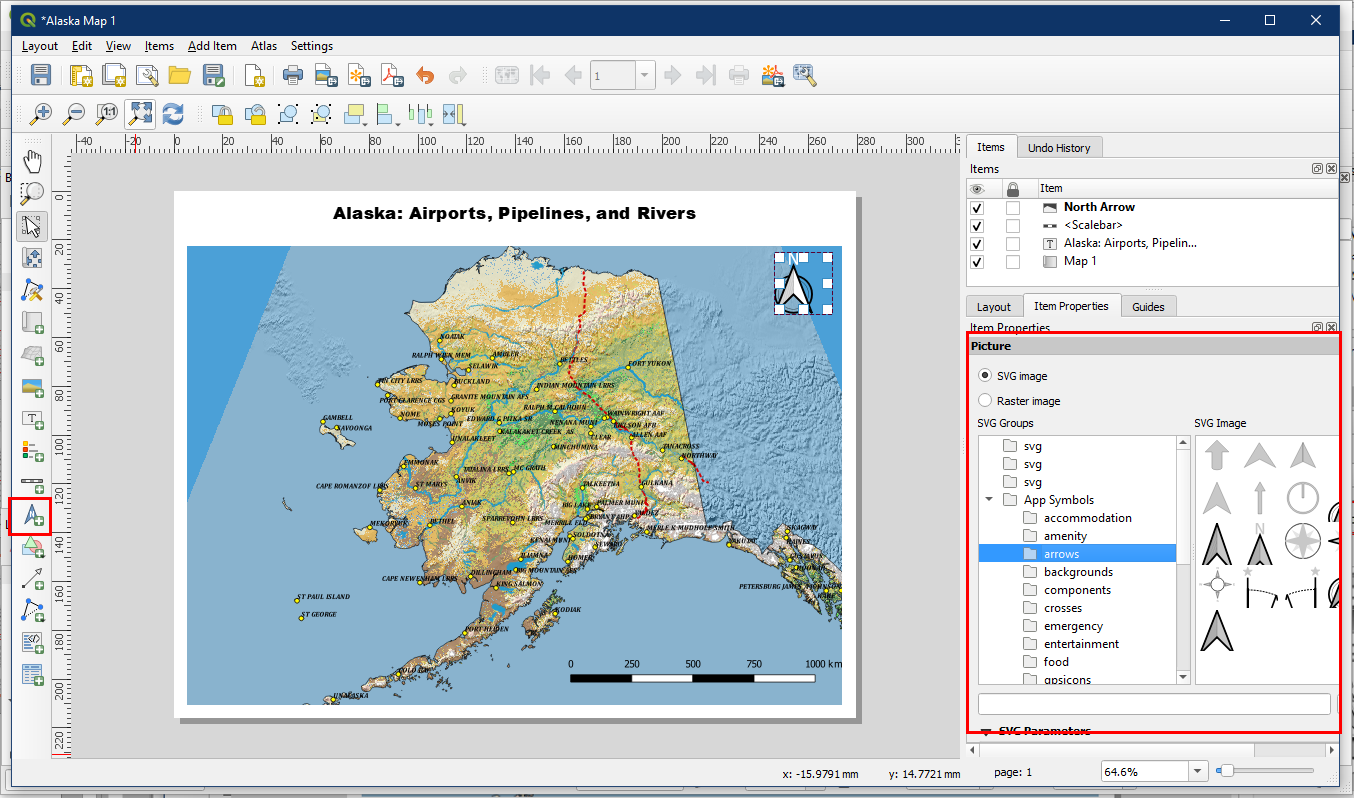
Select the Add North Arrow button to create a North Arrow. You can open the Search Directories section to choose from one of the existing symbols in the library that you like.
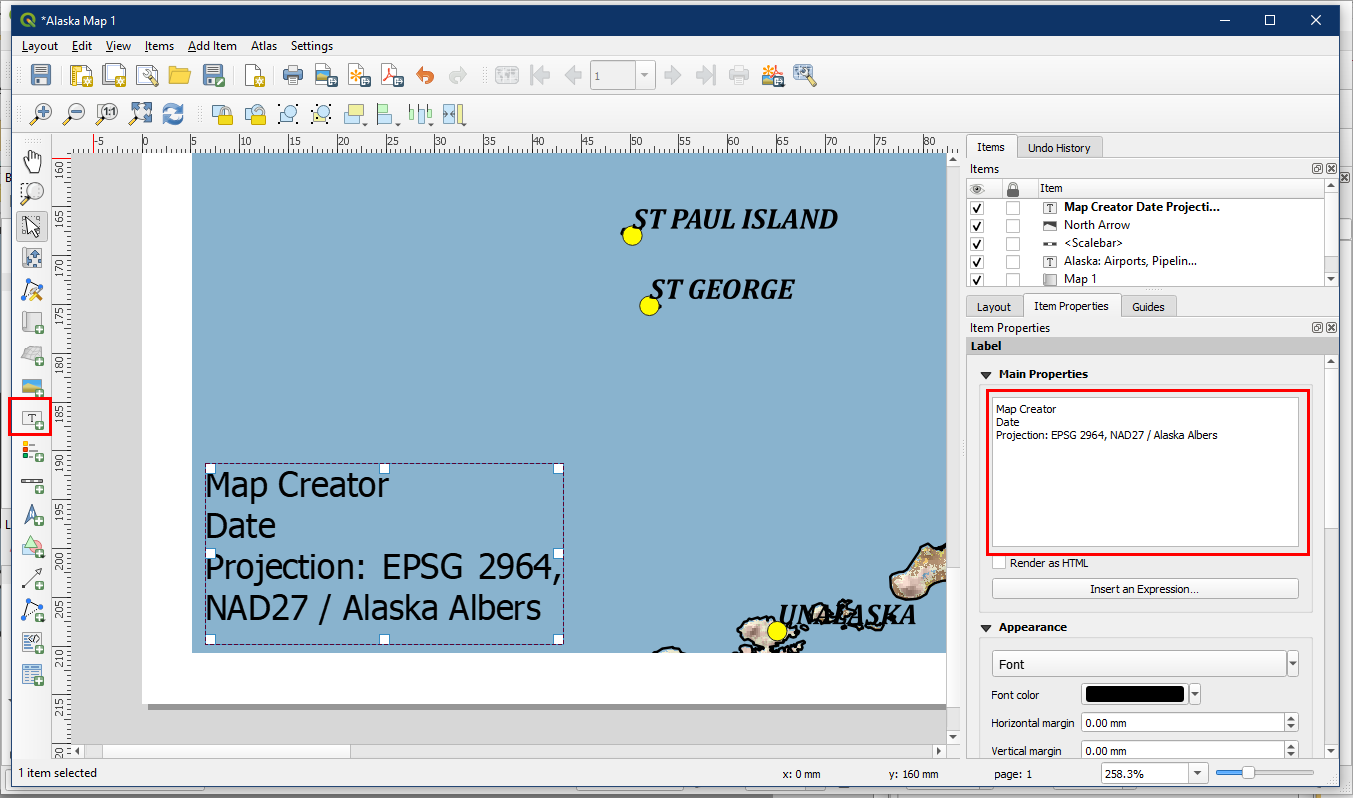
Create another text box using the Add New Label button to add information like name of map creator, date, projection, and any other useful information. Recall that we found the projection information in an earlier tutorial by going into Layer Properties > Information.
We also want to add a legend. Use the Add Legend button to draw a legend on the map.
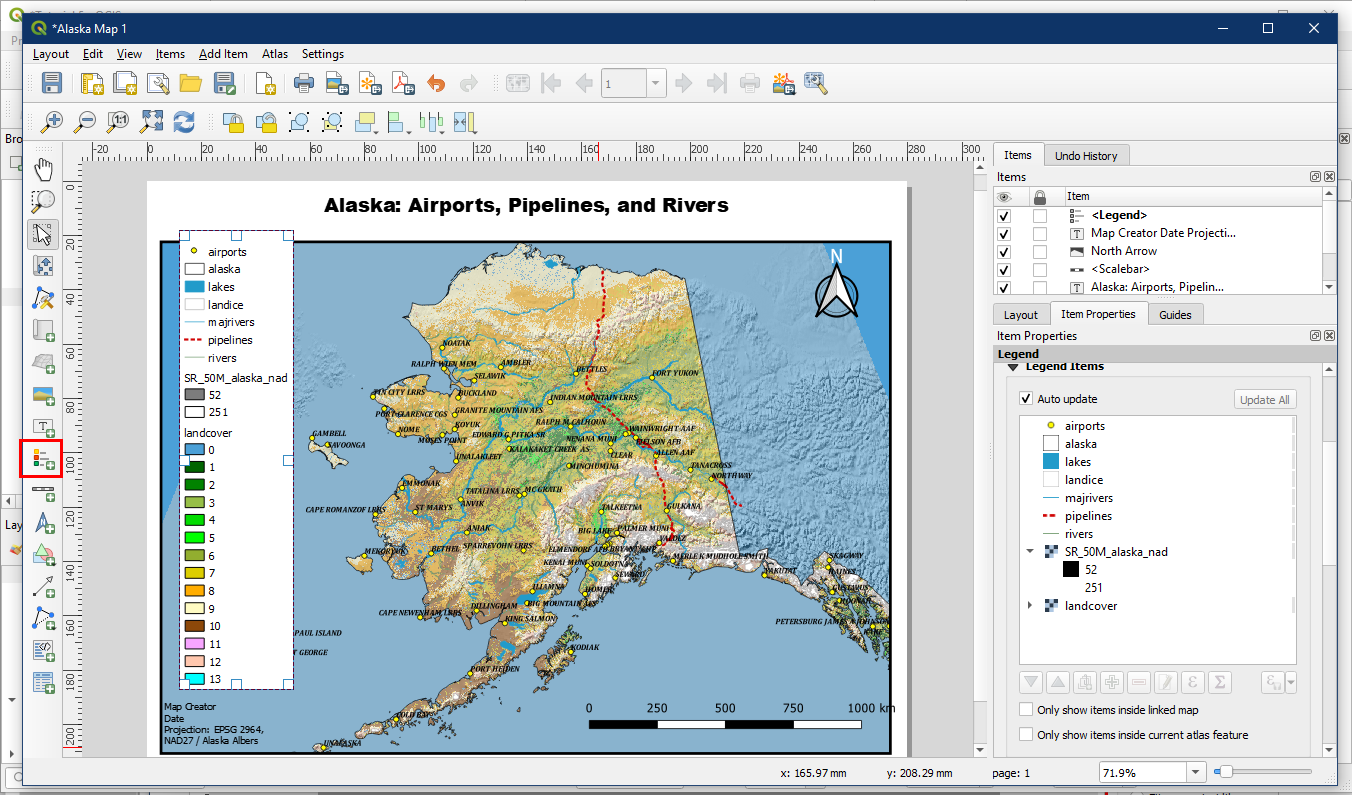
The default legend is very messy so we will have to modify it a bit. So do the following:
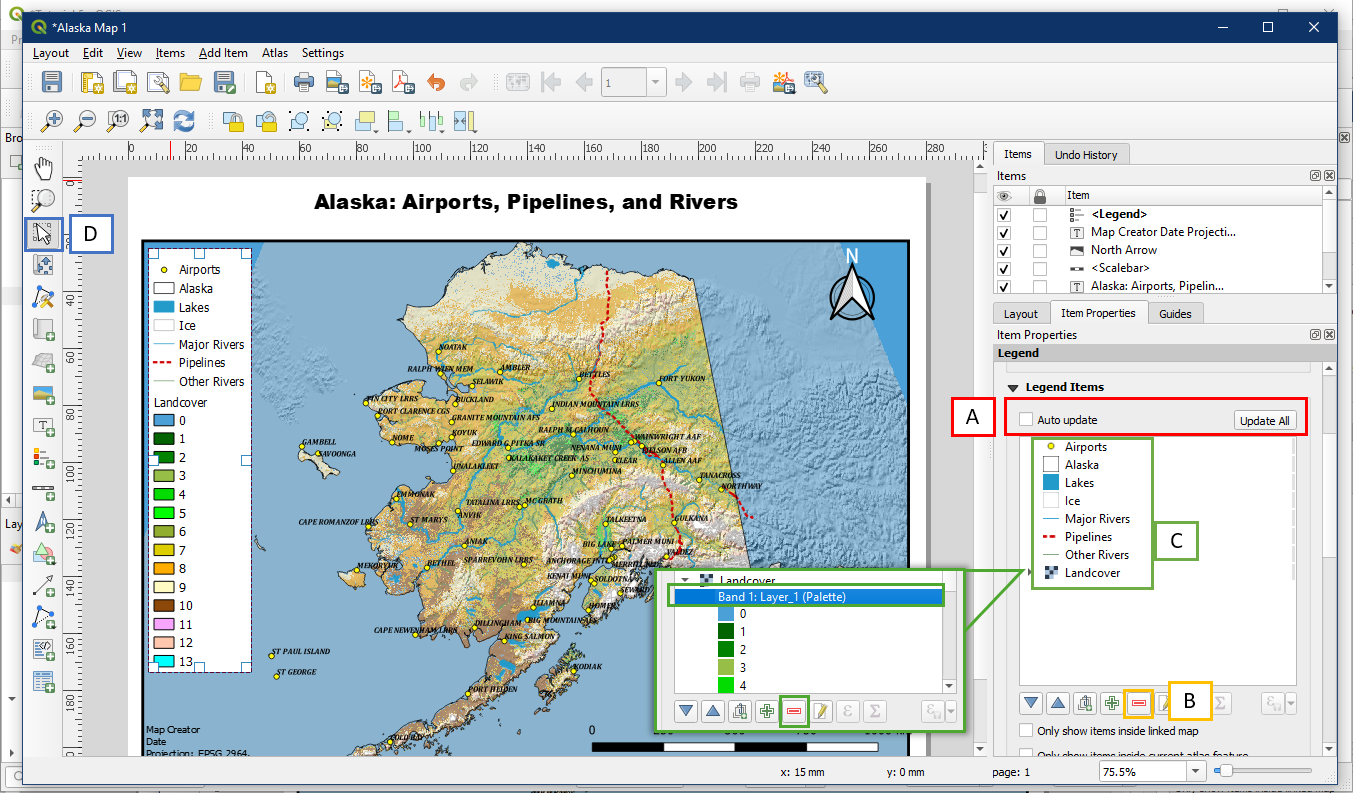
- Turn off Auto Update in the Item Properties. Now we can modify the contents of the legend. Note that if you make any changes in the QGIS layers (e.g. adding a new layer) you will have to click the Update All button to update the legend contents
- Remove the SR_50M_alaska_nad layer by selecting it and clicking the Remove button. The black/white colours simply represent shadows so it’s not important.
- We want to present the information clearly to the map reader, so we will format the legend entries by capitalizing and renaming some entries. Additionally, expand the Landcover legend info using the arrow and remove the “Band 1: Layer_1 (Palette)” text by highlighting it and clicking the red remove button.
- Move the legend box if desired by using the Select/Move button
Finally, we can create a frame around the map. Using the Select/Move Item button, select the main map box again. Under Item Properties scroll down to the Frame section (A) and expand it by clicking the arrow. Ensure Frame is turned on in the check box and give it a thicker line. Note that Grids is also an option under Item Properties (B). We will not use it now, but may use it in the future (refer to Additional Cartographic Tips – Activity: Map Border Frames) .

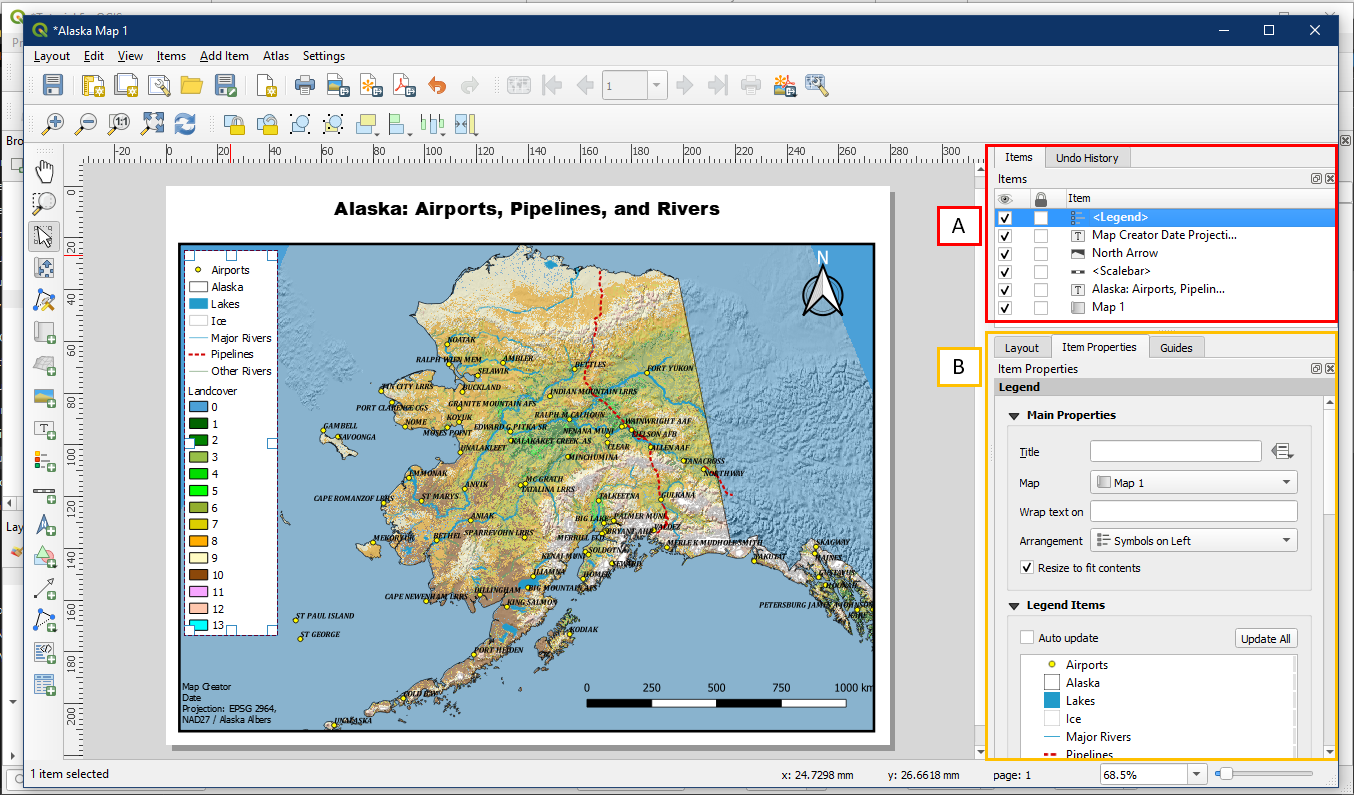
To make further modifications to any map element we have created, select it within the Items panel (A), and adjust the Items Properties as desired (B).
Now would be a good time to save the project using the Save Project button (A). To export the map, go to Layout > Export as PDF (B), and choose a location to save the map. You can use the default PDF Export Options. Good work! You have created a map. Browse to your save location to have a look at your map.

Once you close the map layout window, note that the main QGIS window is still open. To access the map layout again, select Project > Layout Manager. Within the Layout Manager you will see the map we have just created, click Show to open up the map layout again. In the Layout Manager we can also create additional maps using the Create button. Multiple layouts can be saved within the same QGIS project. Save this project as Tutorial_8.
