A viewshed is defined as the locations visible from one or more specified points or lines. Viewshed maps are useful for such applications as finding well-exposed places for communication towers, or hidden places for parking lots.
In this tutorial we examine one of the many uses for viewsheds. In many cases Governments’ preserve viewsheds in urban environments to ensure that property owners maintain views from their homes. This is necessary to protect property views. You will find an article on Vancouver’s old viewsheds or viewcones here. Here is another article about developing buildings that obscure of the views from scenic areas.
Activity 1: Viewsheds
In this activity we want to create a viewshed for Prospect Point in Stanley Park, to assess the areas that are visible.
Open a new QGIS project and add the following layers to the Layers panel:
- Shoreline_2002 from City_of_Vancouver\City_vector_layers folder
- Parks_polygons from City_of_Vancouver\City_vector_layers folder
- DEM_092G raster from 092G folder – symbolize this layer with the topographic colour ramp (Tutorial 10) if you wish

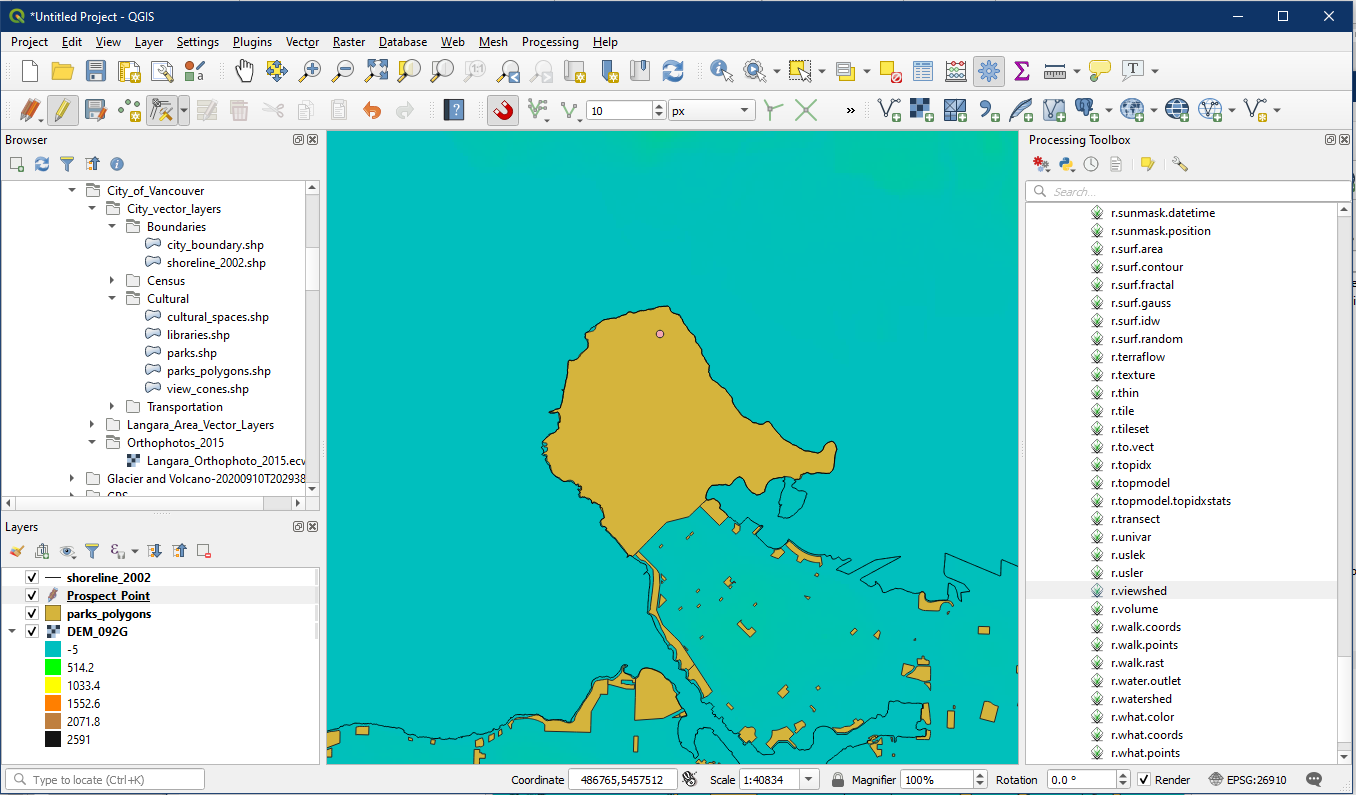
Now we will create a new point layer for Prospect Point. This step is optional, but will be useful for visualizing the centre of the viewshed, as well as being useful for displaying the centre on a map. Create a new point layer with the same EPSG as our other layers (26910), then add a point to the northern edge of the Stanley Park polygon as shown below. Refer back to Tutorial 11 Activity 2 for more information on creating a new point layer.
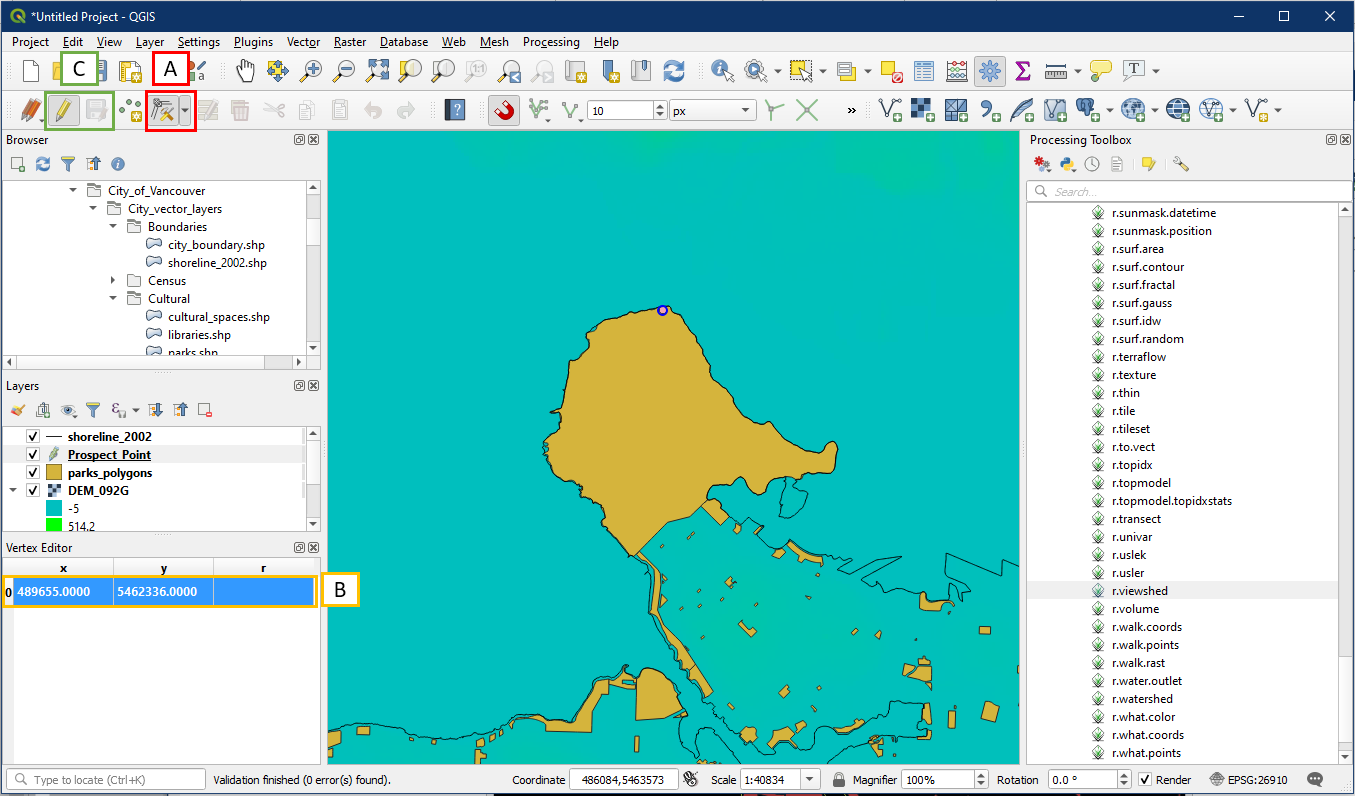
We will now fine tune the location of Prospect Point. While editing mode is still on for your new point layer, select the Vertex Tool (A). With Vertex Tool on, right click on you’re the point you created and the Vertex Editor panel should appear (B). Within the vertex Editor enter the coordinates x = 489655, y = 5462336. Make sure to save your edit and turn off editing mode afterwards (C).
Now we will run the viewshed tool. To access it, go to the Processing Toolbox > GRASS > Raster > r.viewshed (A). Alternatively, search for “r.viewshed” using the search box (B).

In the r.viewshed dialog window, choose the following settings:
- Under Elevation, select the DEM layer DEM_092G
- Under Coordinates identifying the viewing position, enter the prospect points (489655,5462336) while keeping the EPSG text intact
- Under Viewing elevation above the ground, enter 1.85 – this simulates a person viewing from a certain height above ground elevation. In the lab assignment this will be gun height.
- Under Maximum visibility radius enter 5000 – this will be the extent of the viewshed, this is important because by default it is infinity which will take much longer to process
- Click the “…” button to Save to File, choose a folder location and file name for the new viewshed layer
- Everything else can be kept as default. Click Run. Note that raster calculation can take a while so be patient. (Tip: saving your data in your computer hard drive instead of an external flash drive will speed things up.)

The viewshed will look something like this. Notice how there is a range of values, these are angles measured in degrees.

Here is a visualization of the possible values found in the viewshed layer. The values can range from 0° (looking straight below) to 180° (looking straight up) but not the entire range is viewable in most cases.

Create a report using r.report for the Prospect Point viewshed layer (recall Tutorial 17). Raster reports can show us some useful information such as the total area within the viewshed.

Great work. Save your project as Tutorial 19.