Deleted: Mapping in 3D provides new potential for viewing and gaining insights into geographical information using a Geographic Information System (GIS). Using realistic vizualizations and advanced analytics, the GIS user and map reader, may gain clarity while improving engagement and decision making capabilities.Often referred to as “3D modelling” the process of adding the third z coordinate and creating three-dimensional representation of real-world objects has become much easier in the past decade. The advancements in computing power coupled with graphics cards has improved the detailed visualization of geographic phenomenon making it a esential tools in GIS and the solving of problems. Some examples of how 3D modelling and its applications:
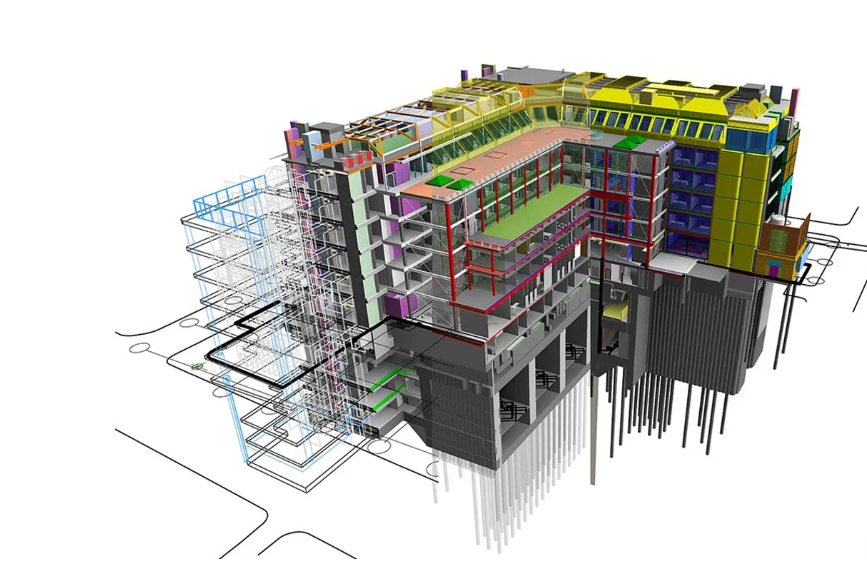
Building Information Model (BIM)
building information modeling (BIM), that integrates information about a building’s internal, structural features, with geographic information systems (GIS), which incorporates soil and subsurface qualities in a building site, which can be preferable for building protection because both foundational and construction quality can be analyzed simultaneously. For example, the suitability of particular building materials and concrete can be evaluated about the soils on which the building is built. Surface and subsurface models are among the outputs, which aid in identifying potential weak spots or vulnerable areas of a building and construction site.

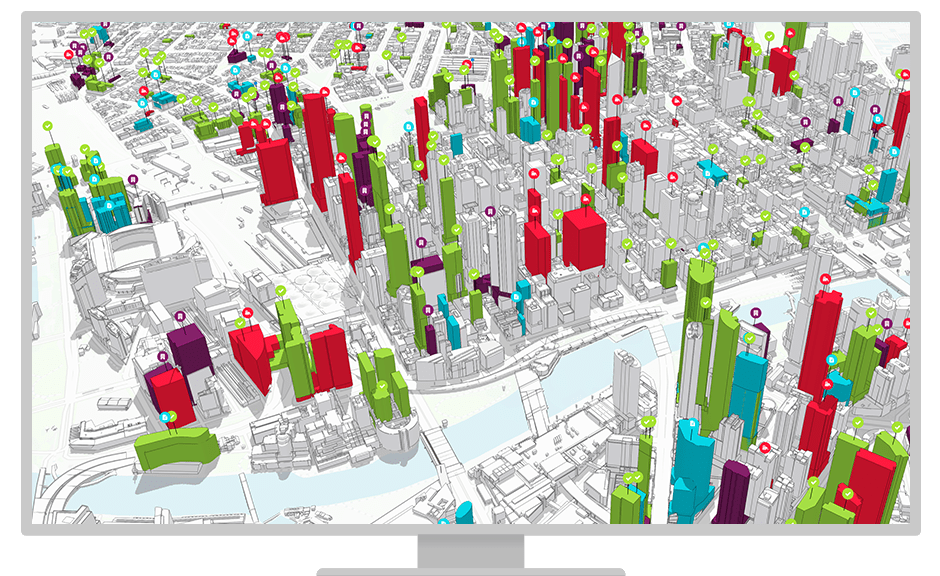
Urban/City Planning
A considerable number of cities are suffering from a lack of basic amenities such as water, electricity, and living space. The issue can be traced back to inadequate resource allocation. Combining 3D technology into GIS can assist government agencies, architects, and engineers in envisioning, evaluating, and analyzing how certain changes in a city will look, and how these modifications will meet the needs of the present and future. A typical 3D model would consist of building information, satellite imagery and traffic data that can be used by urban planners to find alternative solutions effectively and address emergency situations efficiently. Here are some examples:
- Population tracking (migration, demographics);
- Planning for new development or redevelopment;
- Identification of natural or man-made disasters;
- Examination of land use and zoning;
- Examination of growth patterns;
- Assets management and determination of how they are being used;
- Assets management and examination of capacity issues;
- Mapping of city infrastructure;
- Mapping of community assets;
- Mapping of community risks;
- Combining the layers of data to determine socioeconomic status demographic and other factors that affect growth;
- Identification of issues such as crime, infrastructure, and other city problems.
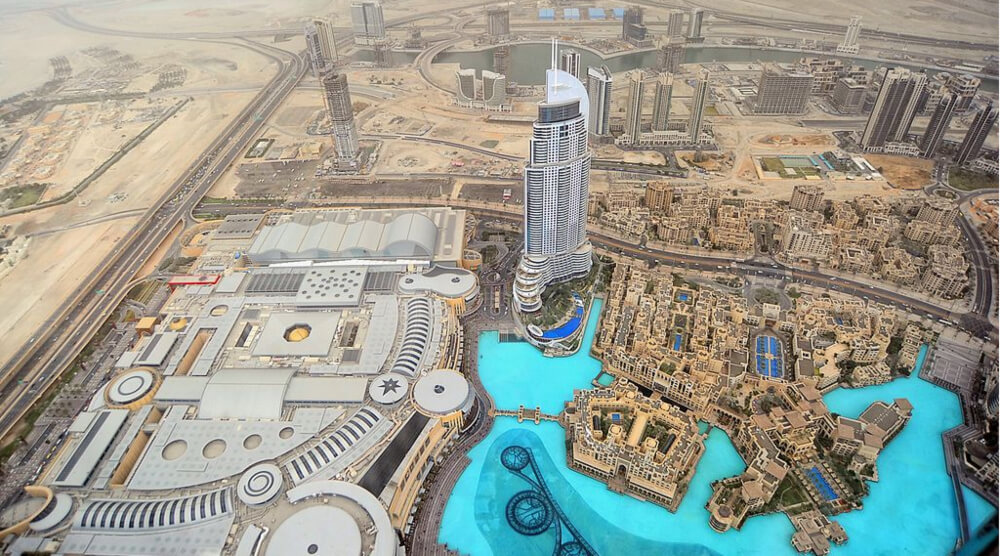
Coastal Modelling
Coastal areas are important as they connect a country with the rest of the world for trade. Coastal areas globally face major threats and challenges for development. It is important for planners to recognize what all factors affect the construction and preservation of ports, fisheries and mining operations. Efficient and effective planning of resources on 3D GIS can provide some level of understanding in the economic, environmental movements along the coast. Resource planning systems that draw on GIS can provide insights into the economic, environmental and cultural results of activities along the coast. The right data makes all the difference in sustainably performing operations like construction or excavation.
Obviously more examples exist, like disaster response modelling, wildfire and forest management, and wind farm location, etc.
3D modelling necessitates elevation data, this information may exist as a digital surface model (DSM), digital elevation model (DEM), or digital terrain model (DTM). Each model employs different methodology and different elevation values (data).
Digital Elevation Model (DEM)
A digital elevation model is a bare-earth raster grid referenced to a vertical datum. When you filter out non-ground points such as bridges and roads, you get a smooth digital elevation model. The built (power lines, buildings, and towers) and natural (trees and other types of vegetation) aren’t included in a DEM.
Digital Surface Model (DSM)
Light pulses travel to the land surface in a LiDAR system. When a light pulse bounces off its target and goes back to the sensor, it provides the range (variable distance) to the Earth. Finally, LiDAR produces a massive point cloud with elevation values. Height, on the other hand, can come from the tops of buildings, tree canopy, powerlines, and other features.
A DSM is a representation that depicts the natural and man-made features of the Earth’s surface. A DSM can be used to create 3D models for telecommunications, urban planning, and aviation. DSMs are widely used in fields such as urban planning because they represent the bare Earth and all of its above-ground features. For instance, investigating how a new project would affect the views of residents and businesses, inspecting power line corridors, and planning aviation.


Digital Terrain Model (DTM)
Digital Terrain Models (DTMs) are commonly regarded as synonymous with bare-earth DEMs, emphasizing their focus on representing the geodesic surface without considering persistent above-ground features such as vegetation, buildings, and artifact. DTMs can also be a vector data set where elevation is compose of regularly spaced points, and augments a DEM by incorporating linear features like ridges and breaklines for an enhanced representation of bare-earth terrain. DTMs are typically created through photogrammetry as in the example above. For example, contour lines are in purple. The DTM points are regularly spaced and characterize the shape of the bare-earth terrain.

Activity 1: Creating a quick 3D Map
Open up a new project and load your 092G shaded relief and DEM layers, and symbolize them based on your liking (refer back to Tutorial 17, Activity 2). The important layer is the DEM, which is needed to display elevations in 3D.
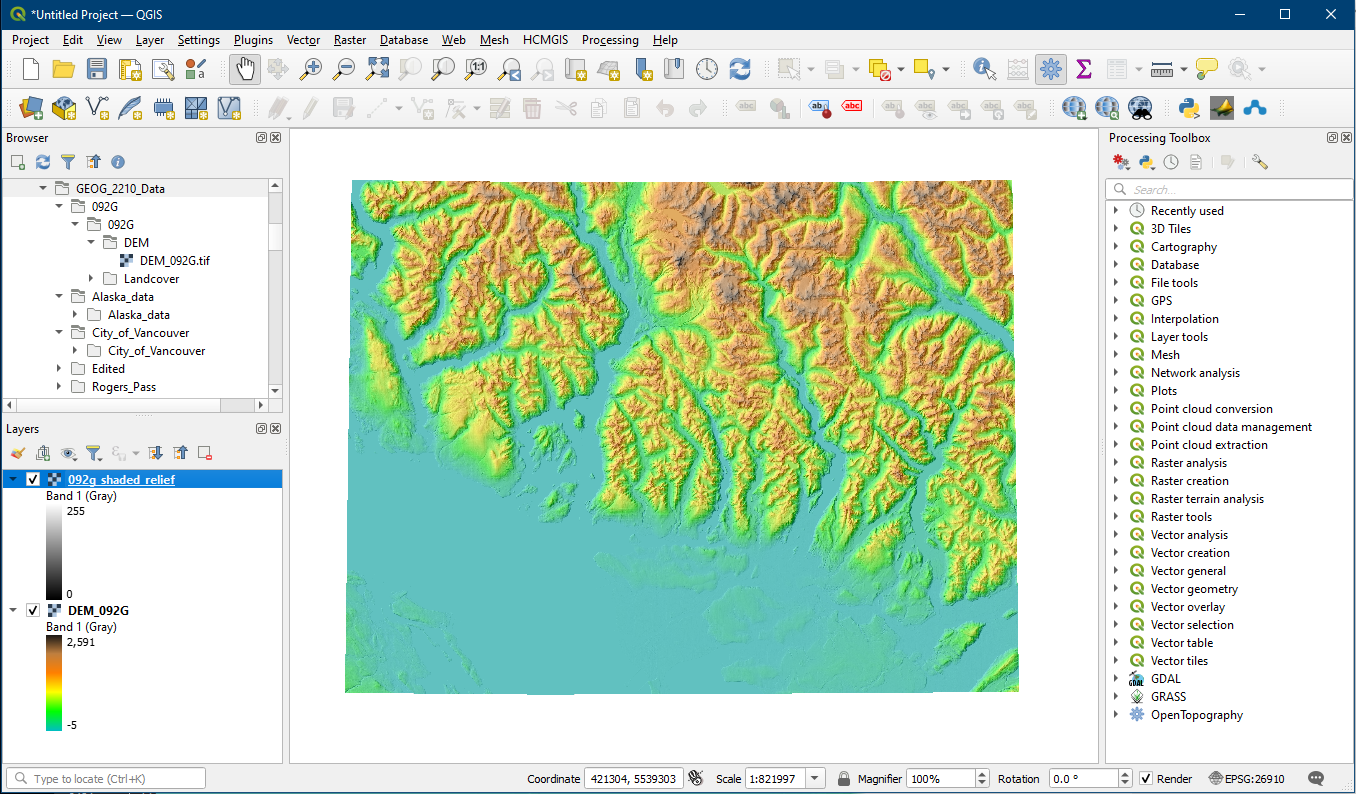
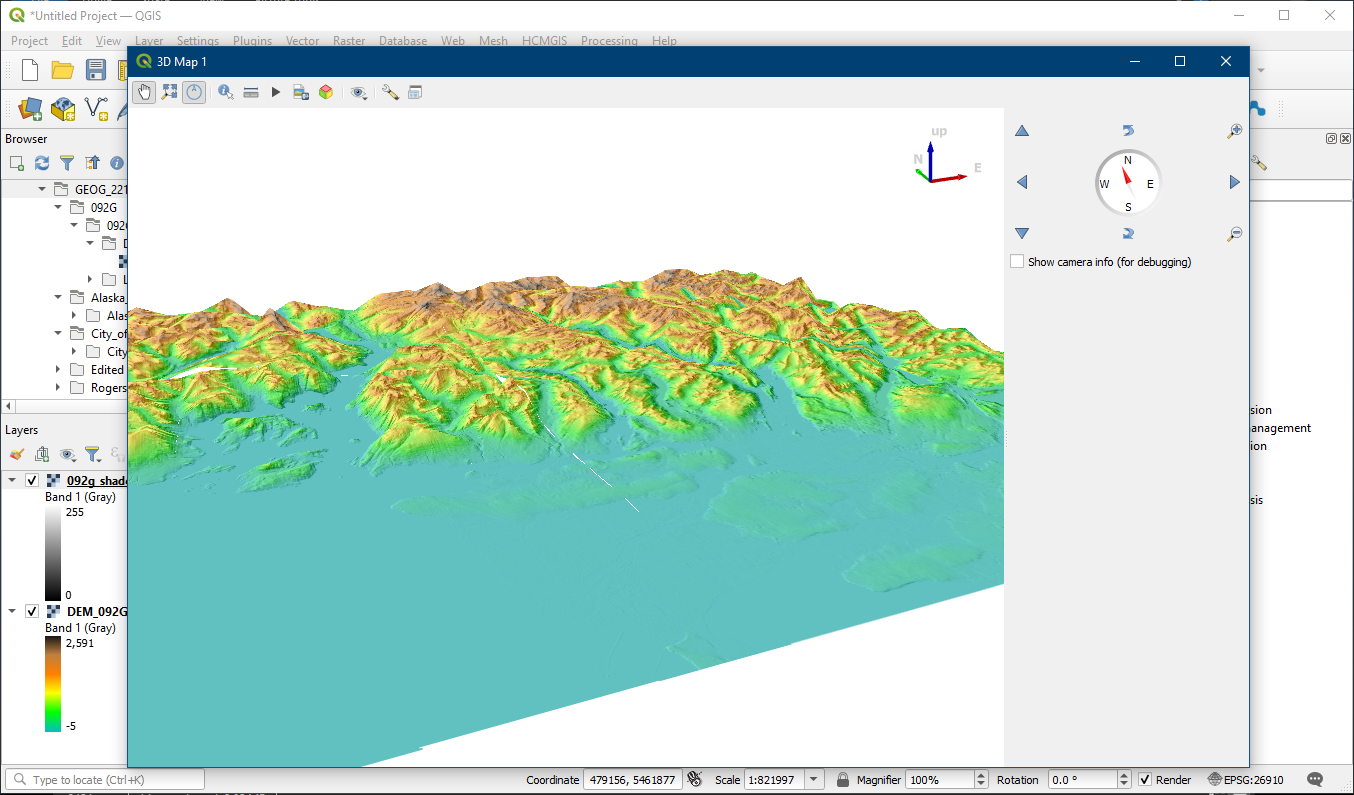
Click View -> 3D Map Views -> New 3D Map View
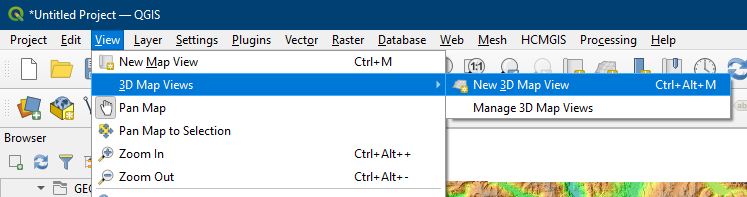
A new window will appear with the layers displayed in your layers panel. You can use your mouse buttons to navigate: hold down the left mouse button to pan, hold down the right mouse button to zoom, and hold down the middle mouse wheel to rotate. Alternatively use the compass on the right side to navigate. You will notice that currently, the image appears flat.
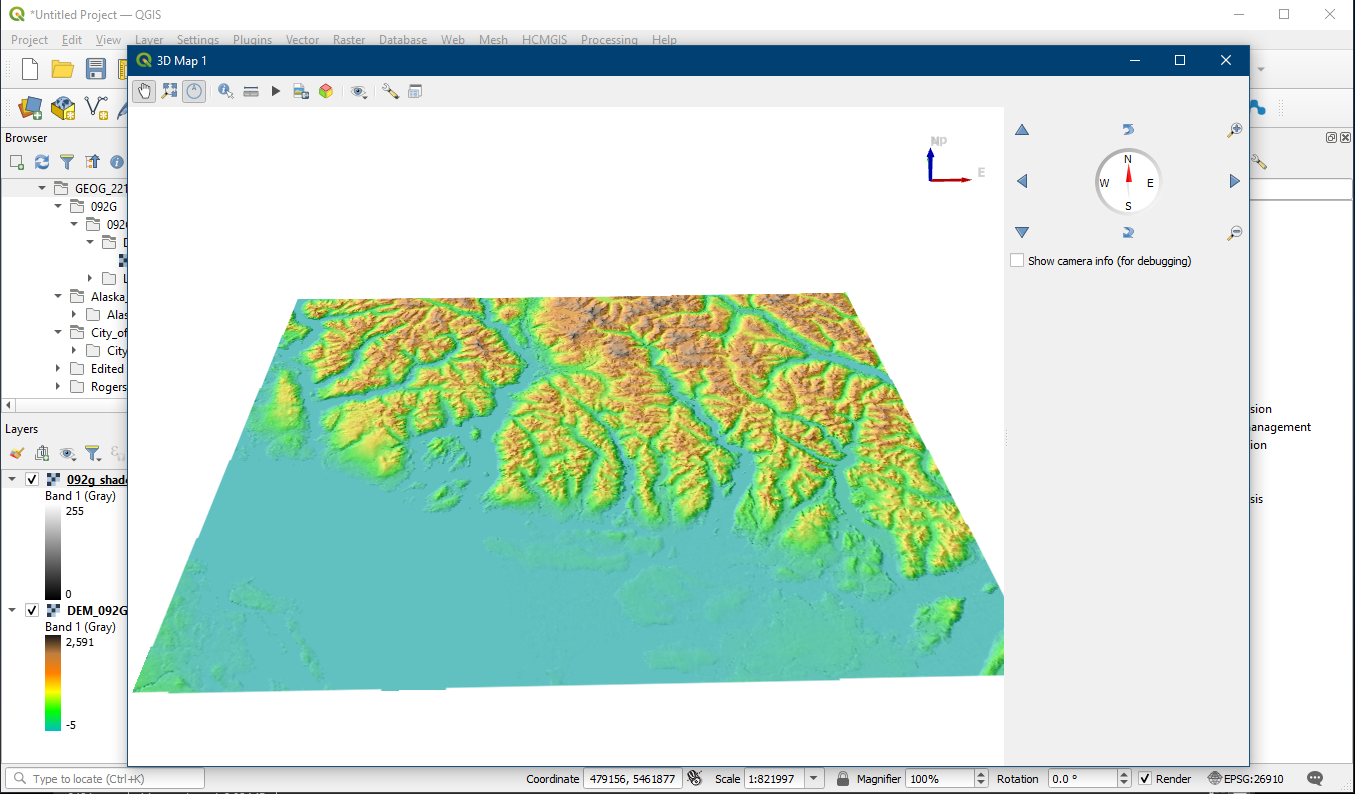
To add 3D terrain:
- Click the Options button
- In the new 3D Configuration window choose the Terrain tab
- Within the Terrain options, choose Type = DEM (Raster Layer), and specify your DEM data. Then choose a Vertical scale that looks good to you, for now use 2.5
Now your display will show 3D. When you have created a 3D view you are happy with, do not close this window. Keep the 3D Map window open in the background or minimize it, and create a new Print Layout.
In the Print Layout window, click the Add 3D Map button (A) to add a new 3D view to your page similar to how we create regular maps. Click Copy Settings from a 3D View button (B) to update the view from your 3D window. Note that if you closed your 3D Map window then this button will be greyed out. We cannot edit the 3D view in the layout, so if you want to alter the view you will need to do so in the 3D Map window, then click the Set from a 3D View button (C) to refresh it in the layout.
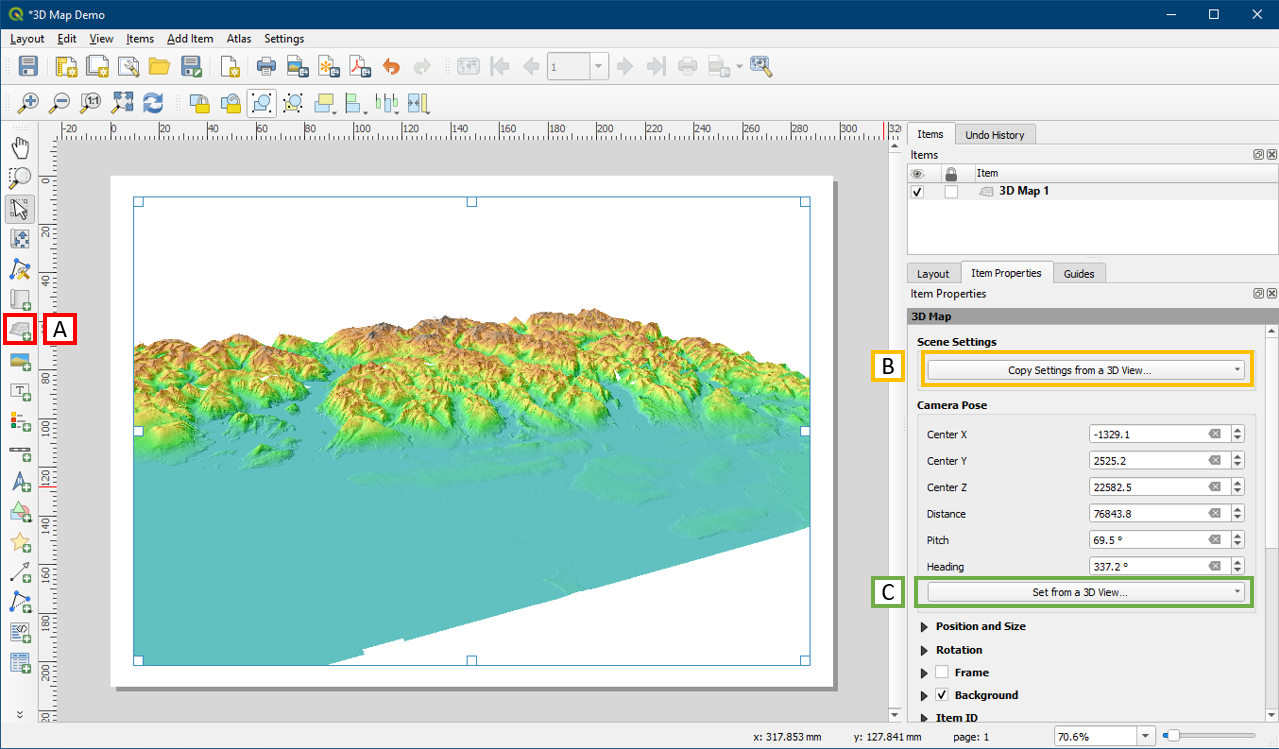
You can now add the other map elements, although the North Arrow and Scale bar will not be useful here due to the 3D nature of the map. Nice work!
Activity 2: Creating a 3D Satellite/Landuse map using various tools
This activity will involve accessing a basemap and creating a georeferenced image (.tif) that we will later drape over a DEM in a later activity.
Step One: Find a location using Google Maps.
Open Google Map from a Google Chrome browser. In the top left search for “Prospect Point Lookout”, copy the coordinates of the location by “right-clicking” the placemark or point and saving to the clipboard or copying them.


In QGIS, using the Plugins tab, install the plug in “Lat Lon Tools”
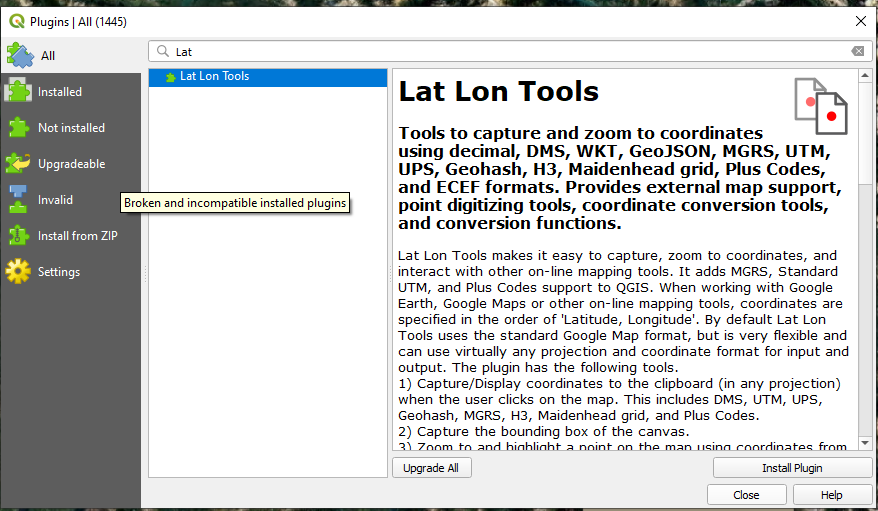
Using the Lat Lon Tools plugin, under the Plugins tab, choose Zoom to Coordinate, you will notice a panel appear in the bottom left panels area. 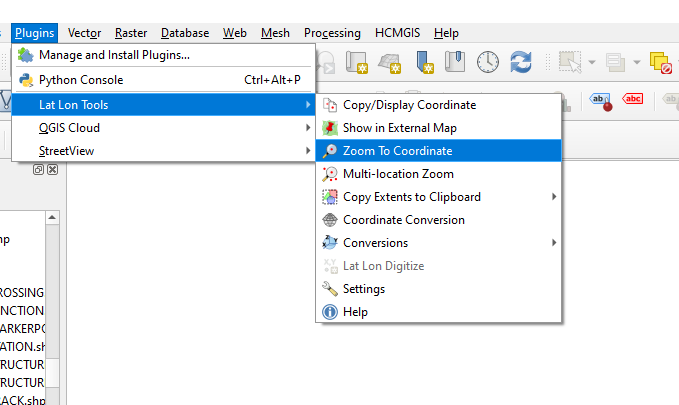
Returning to Tutorial 22, Activity 3 open the “HCMGIS”plugin via the t6ab on the top menu bar.
Load the “Google Satellite”option and you should see the world.
Using the Zoom to Coordinate panel box, paste your coordinates from Prospect Point Lookout.
*hint, make sure you have the X,Y in the correct order using the icon. X = Longitude & Y = Latitude
A red “plus sign” will appear on your map.
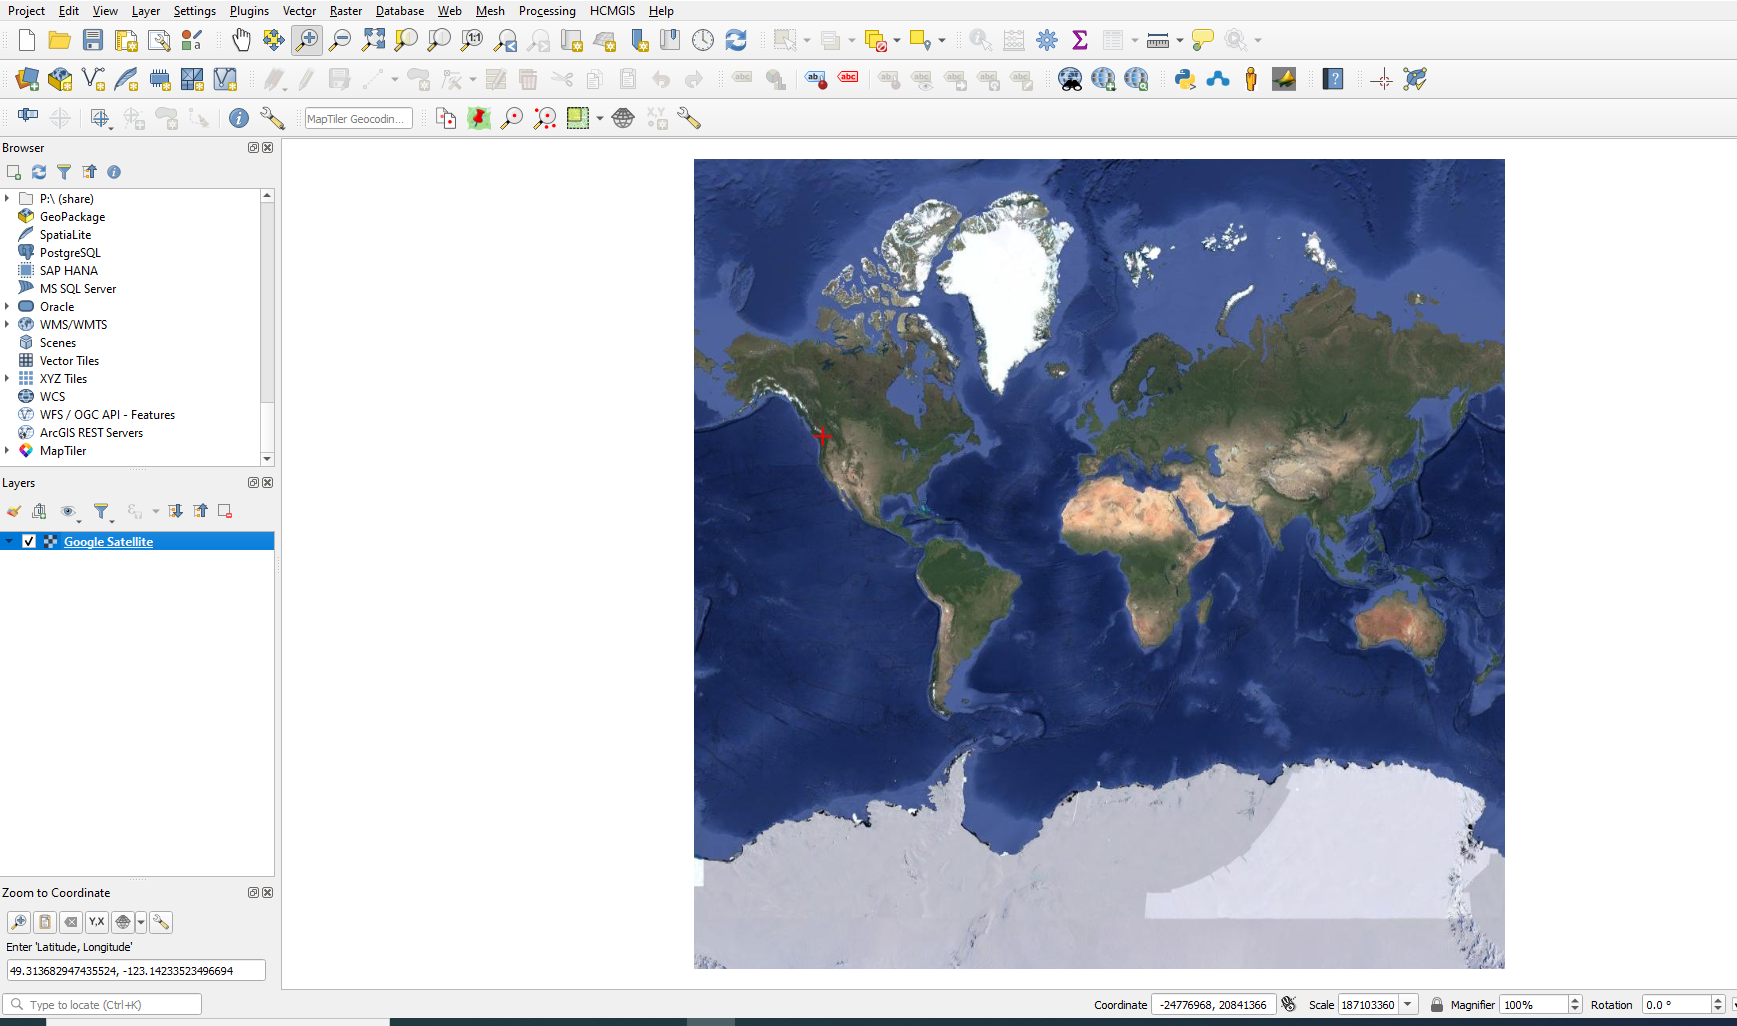
Use the zoom function to change the map scale and find Prospect Point Lookout.
![]()
+ 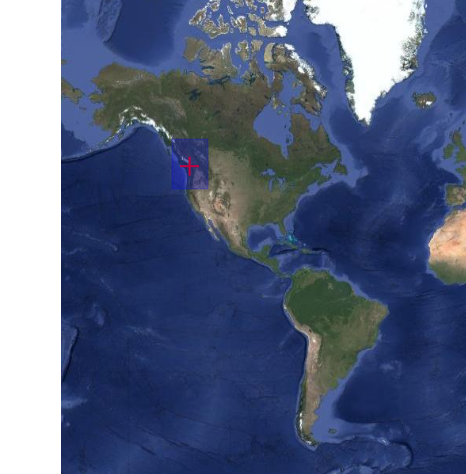
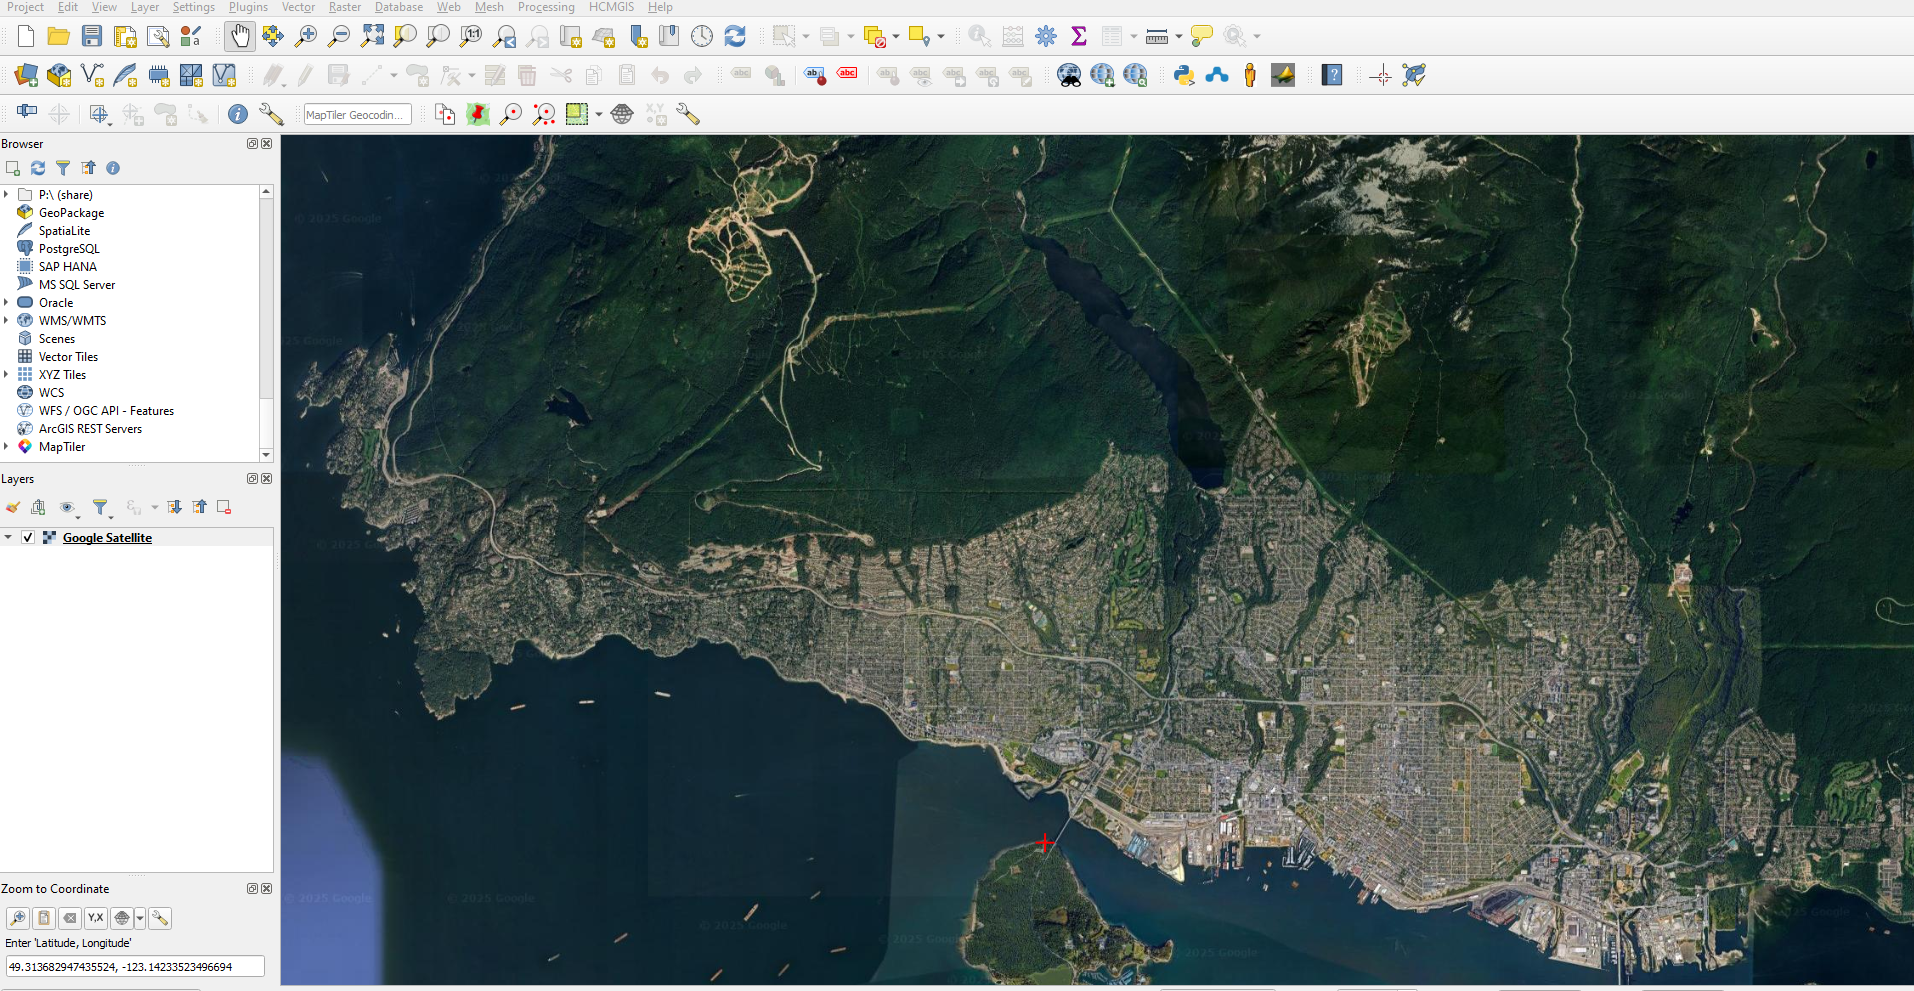
At a scale of 1:85000 your image and positioning should look like this
Clear away the red cross or plus sign from the Zoom to Coordinate plugin.
Now create the geotif image – or georeferenced image.
Open a New Print Layout and name it Prospect Point Lookout, Add Map and ensure you fill the entire page.
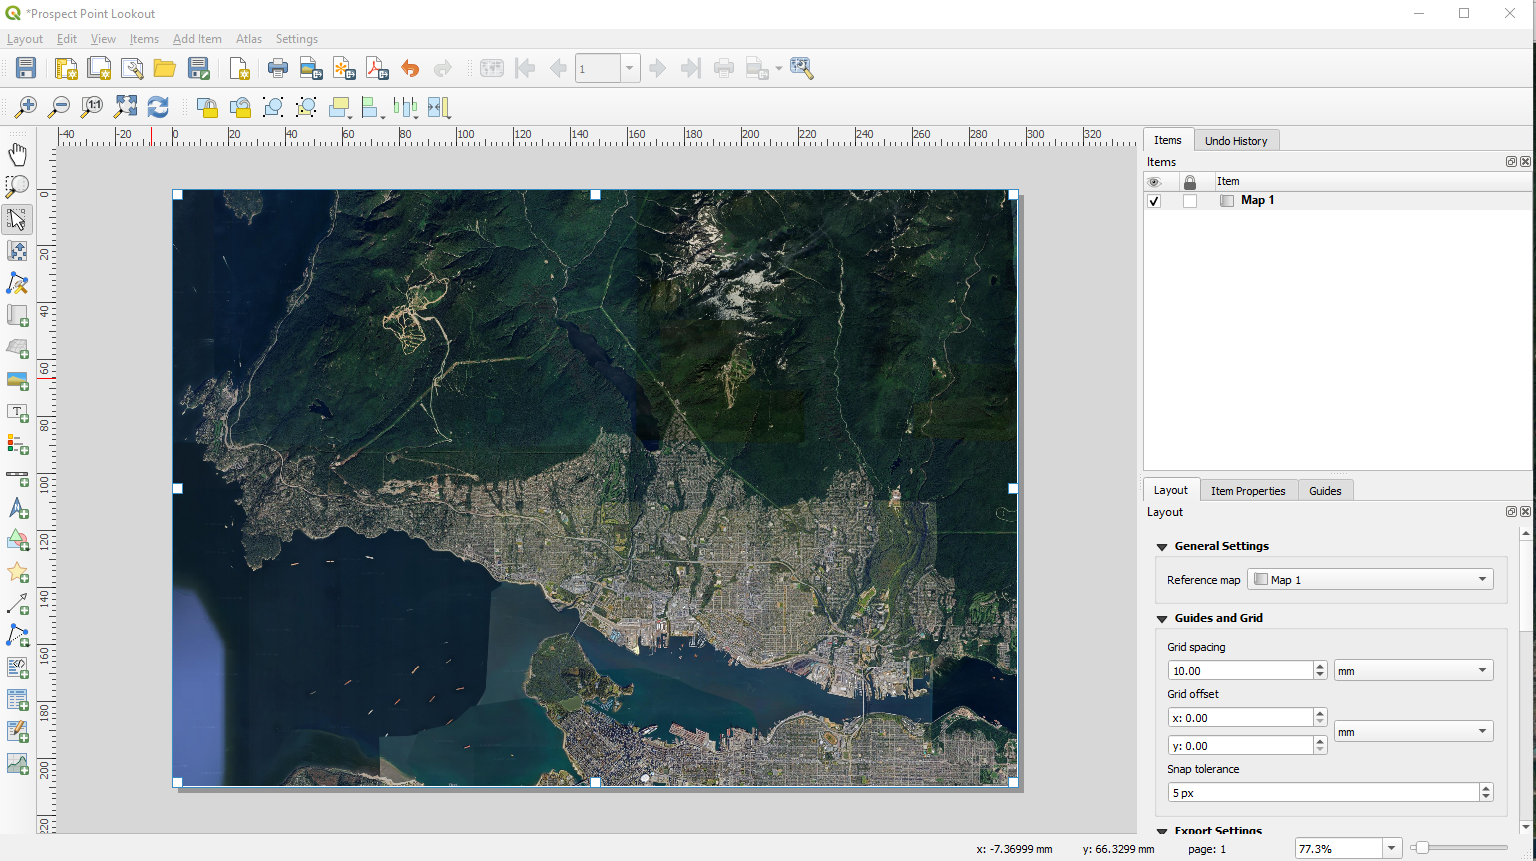
Export as Image, name the file “Prospect Point Lookout” and choose .tif as the file type.
In the Image Export Options box choose 8192 px (pixels) as the Page width (this is the maximum resolution obtainable from Google Earth Satellite. Check the Generate world file box.

It may take a moment to generate the image. Close the Print Layout
Locate the “Prospect Point Lookout” tif file in your QGIS Browser panel, and import it into the Map View.
Turn off the Google Satellite layer.

Finding and Incorporating DEMS:
There are a variety of options for incorporating Dems into your QGIS project. You will learn two in this activity.
Step One: Using the Plugins menu install the Open Topography DEM downloader plugin.
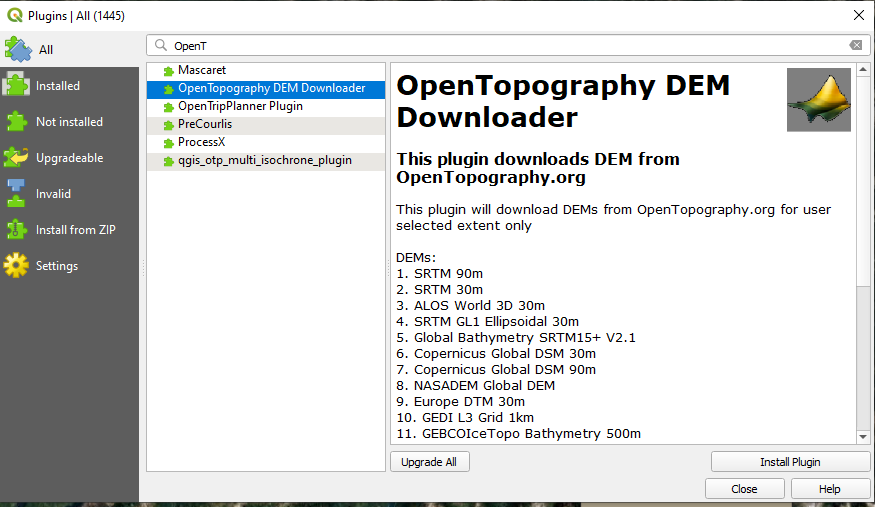
Using the Raster tab from the top menu choose “Open Topography Dem”
From the DEM Downloader box, select SRTM 30 (you will see lots of options, some you may need an API key for access), choose the Prospect Point Lookout layer when defining the extent to download. use the following API key “fbb08a06f9c47661d07ba53118c7de05”, Name the Output Raster and “Run”.
If you want to do this in the future, you will need to get your own API key here are the links: Open Topography
Get a ORCID number too, this will aid in your ability to access other information in the future: ORCID
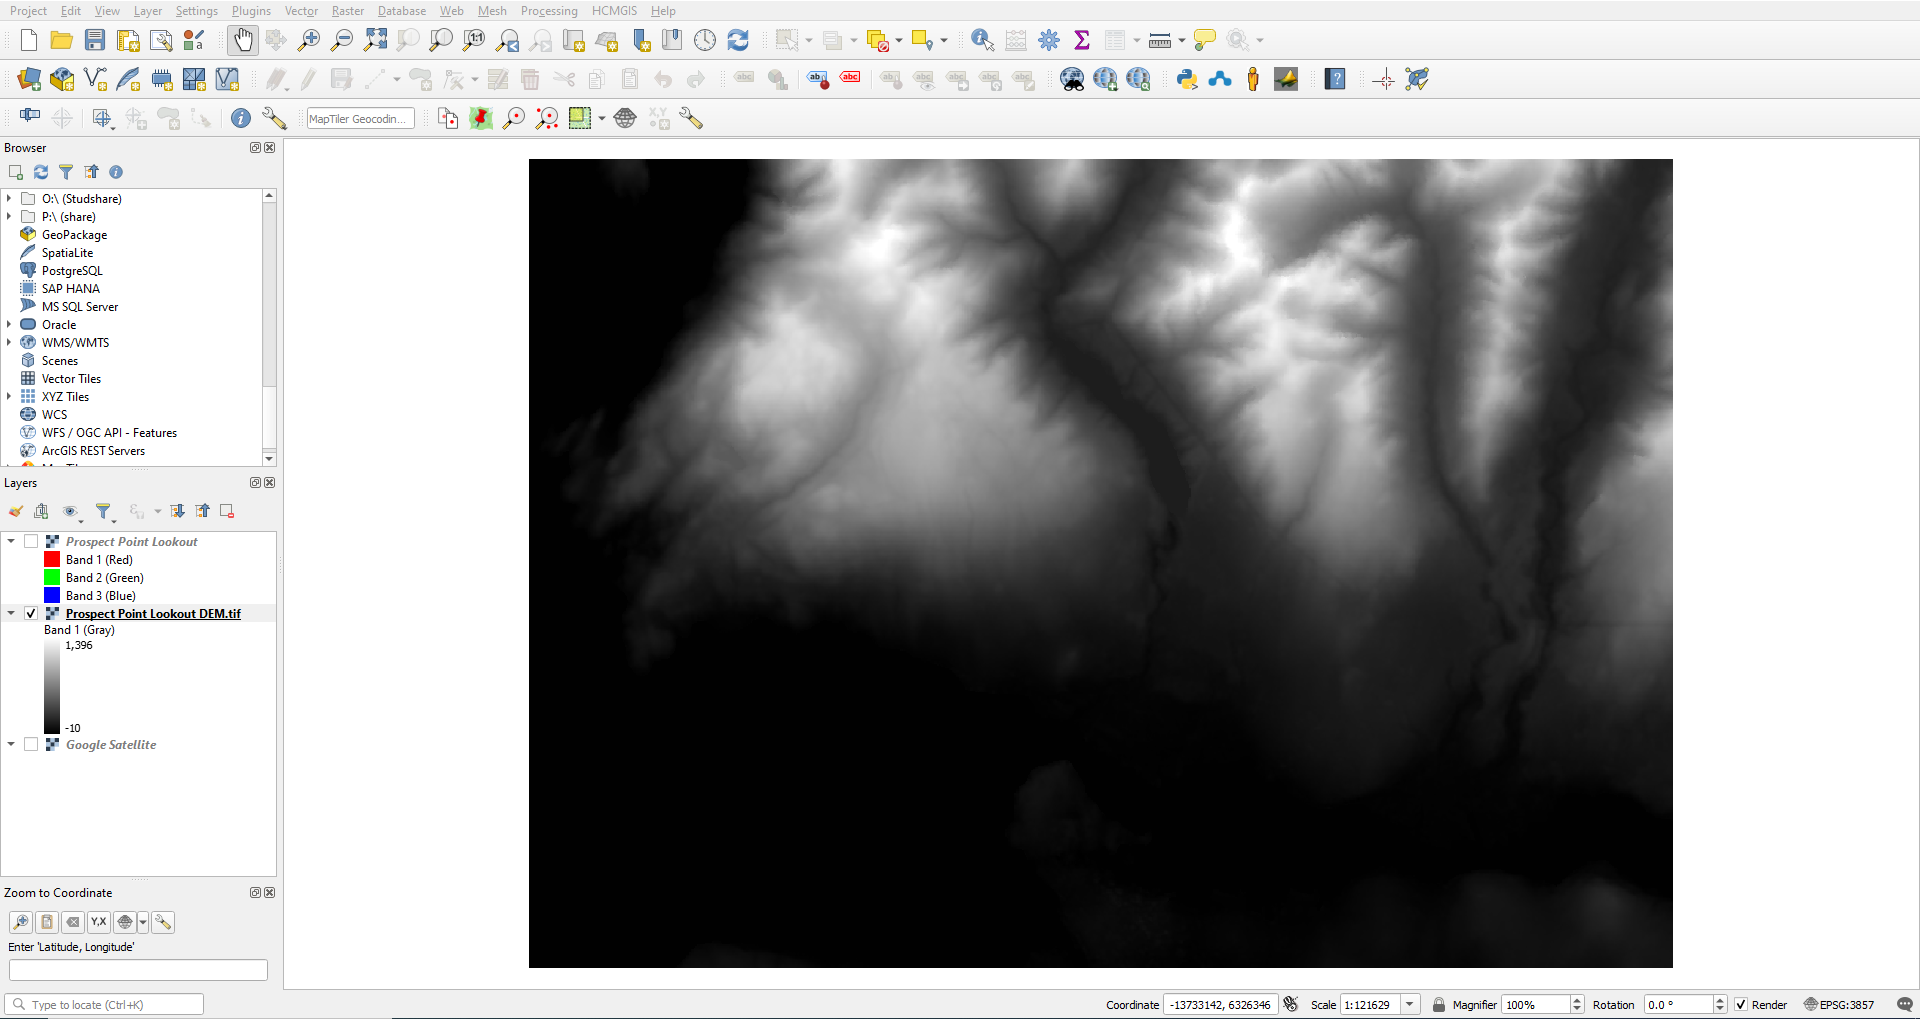
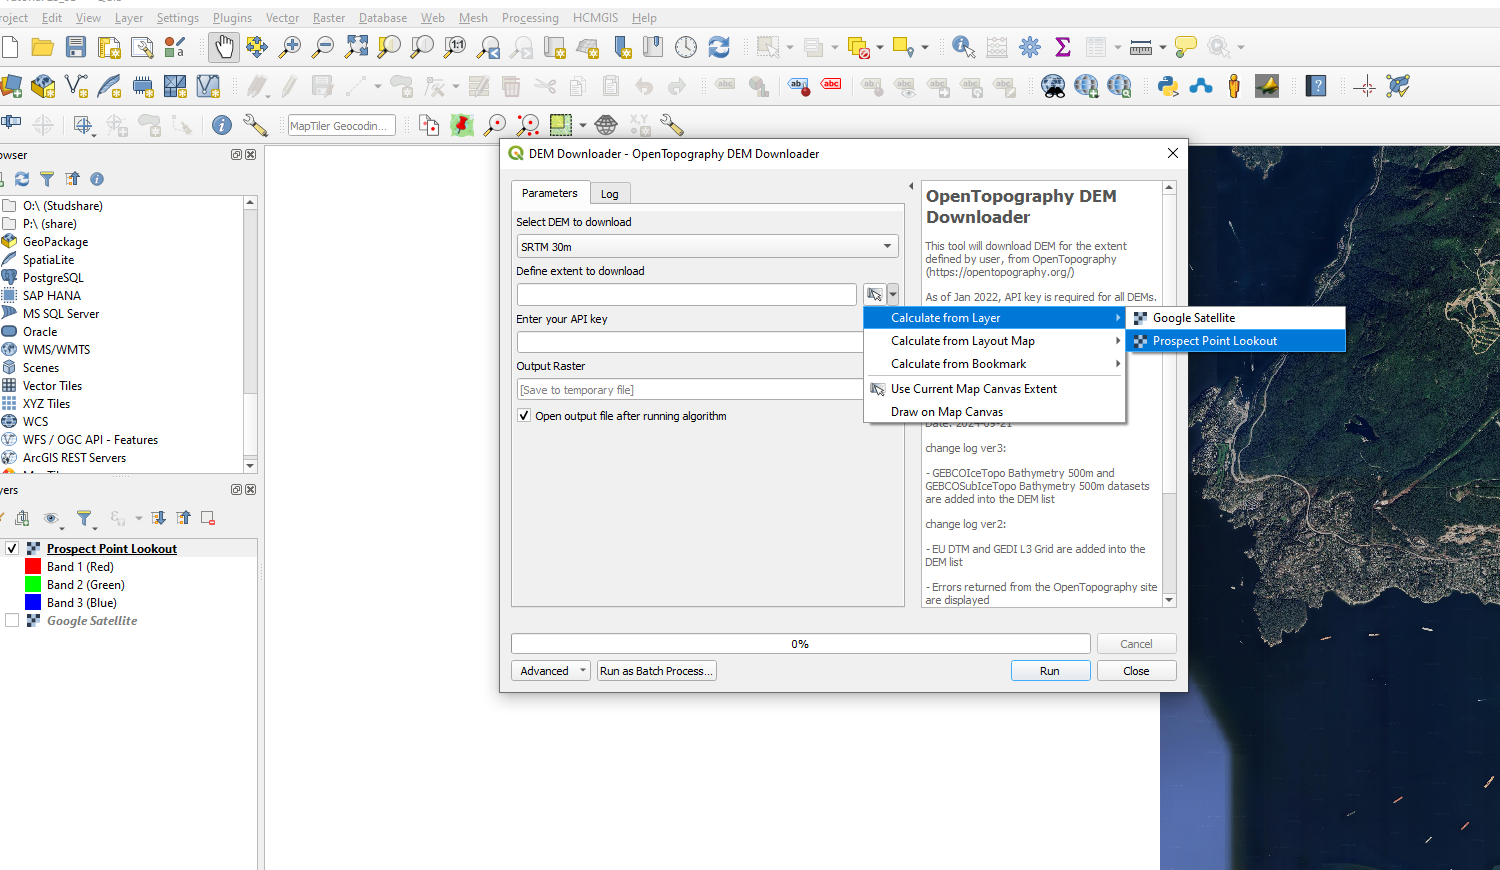 Do you see something like this? What is the resolution of this raster or the pixel size? Answer = 30 metres
Step 2: Canadian DEMs
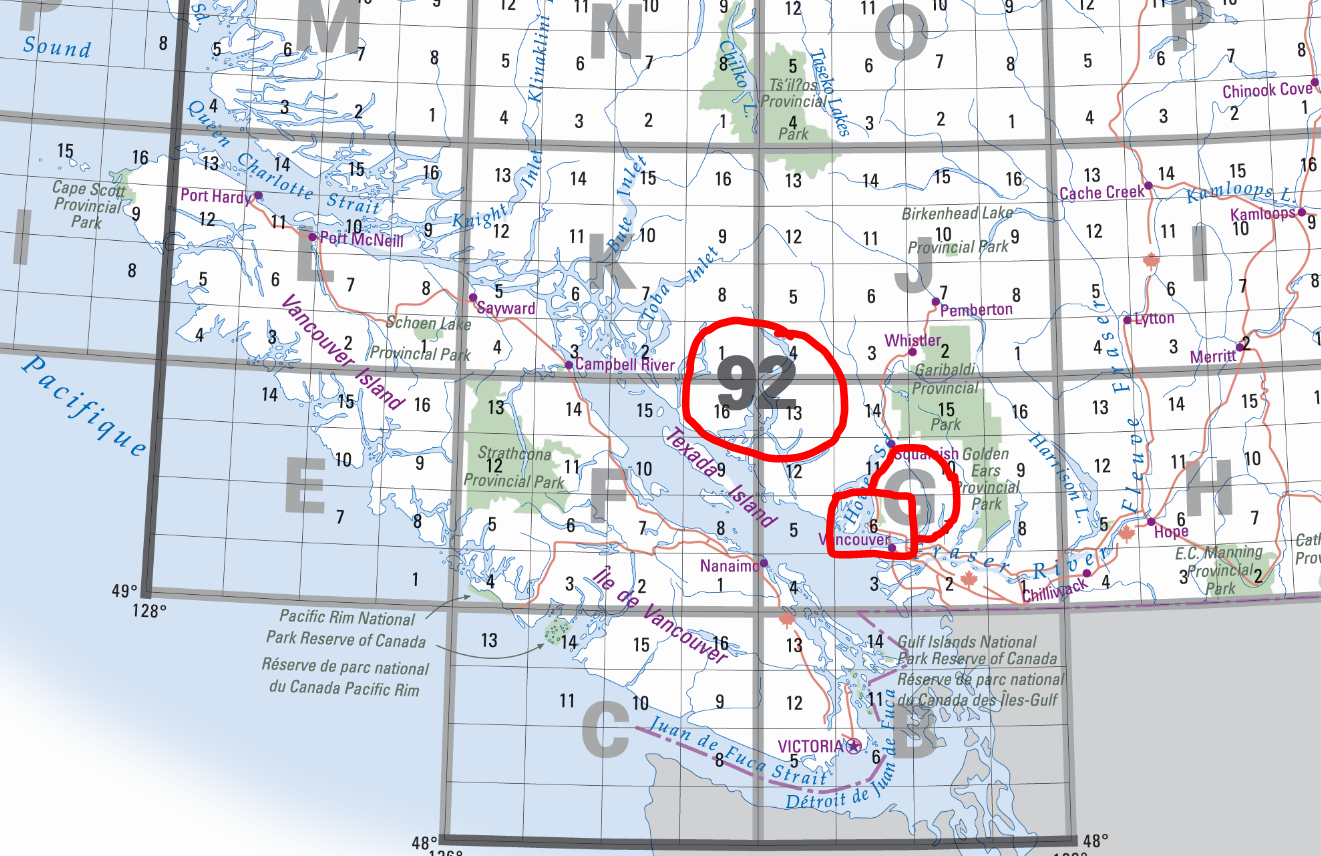
Canada has DEMs available at a variety of resolutions depending upon the areas. Although work is being done to increase the availability of high resolution DEMs and DSMs, the best overall coverage for larger areas has a 20m resolution currently. Canada uses the National Topographic System (NTS) to index the various regions and data. Below is an example of Canada’s NTS at different scales. This is a link to the Canadian NTS index images.
This is the BC Index. 
Zooming in, you can see we are after the tile 92G6 if we would like a DEM that includes the area of Prospect Point Lookout
If you are interested in downloading the Canadian NTS Grid as a shapefile, or KML file here is the link
Accessing the 92G6 DEM is possiblehttps://open.canada.ca/en through an FTP site Canada’s Open Data network
Using this FTP server, you want to locate the 92 folder and then download the 92G_tif file. Unzip this file and place it in your folder so you can access it from the Browser panel.
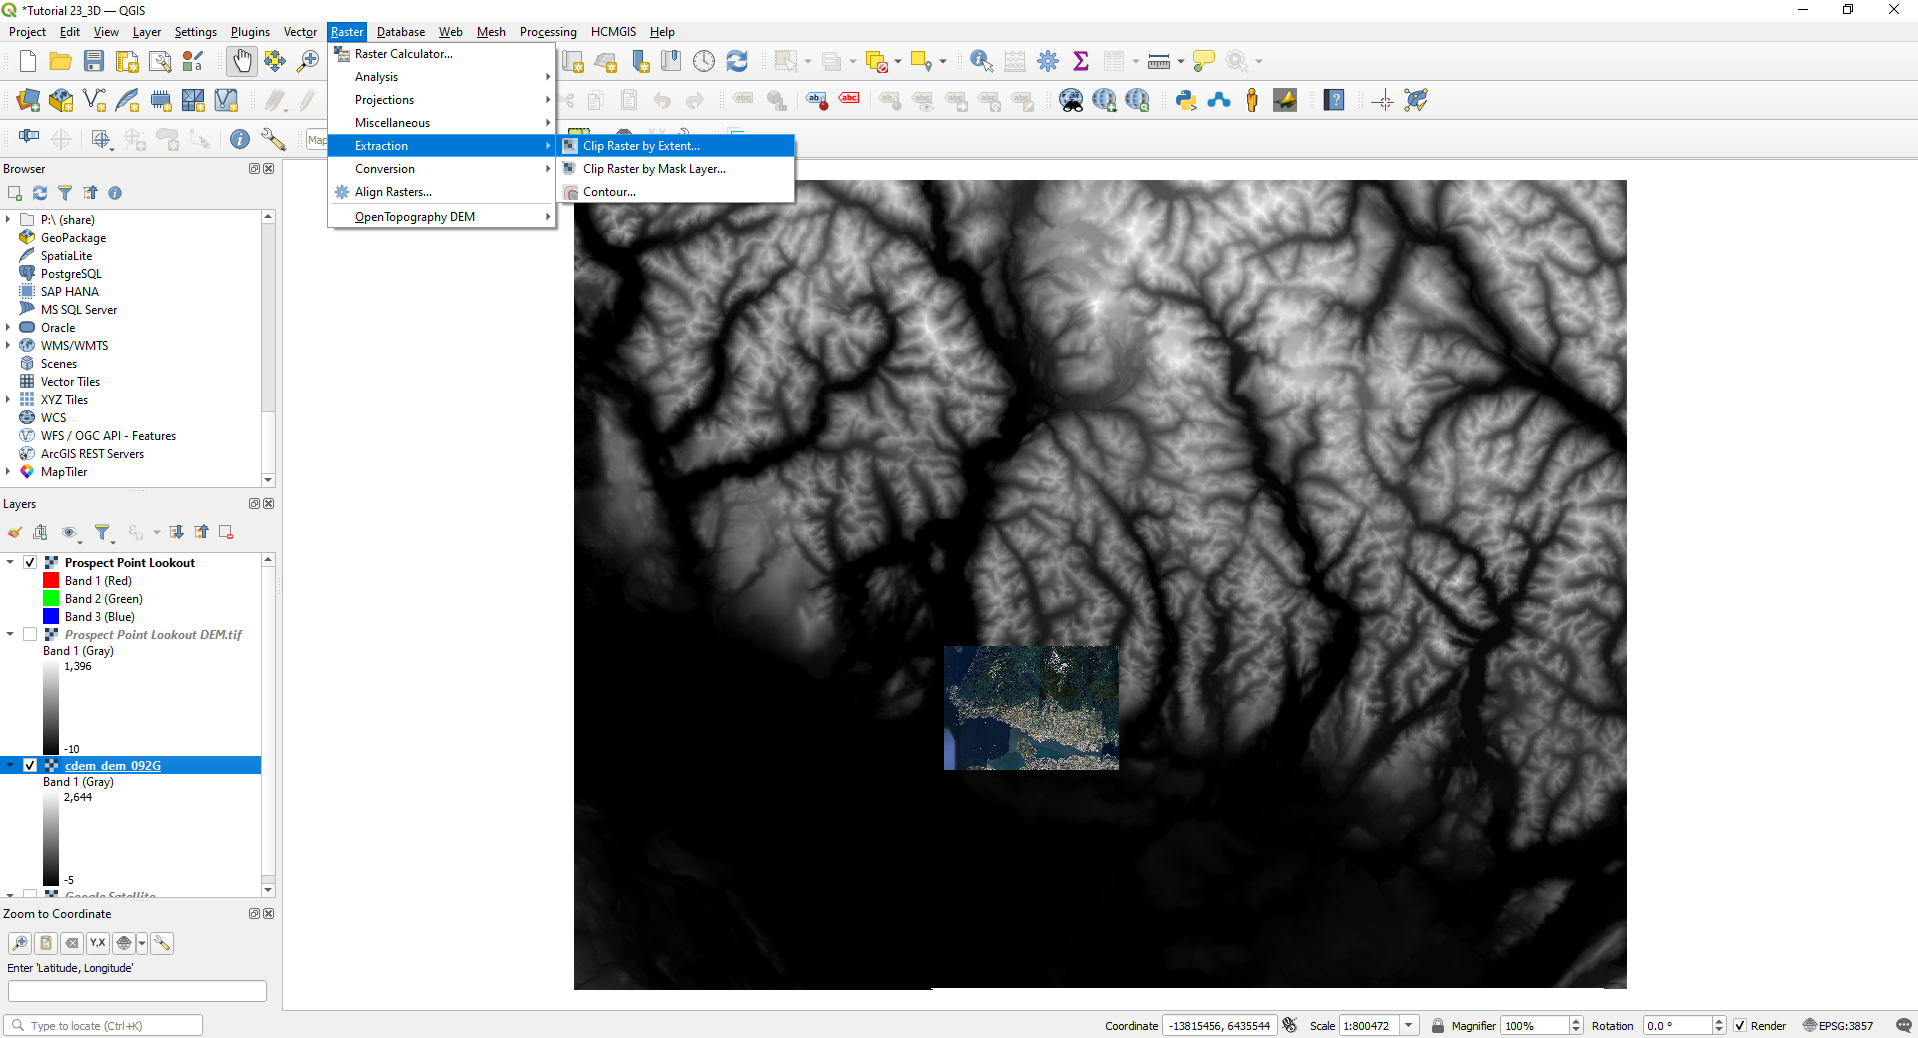
Load the “cdem_dem_092G”layer into the Map View. It should look like this. Looks familiar? This is the 092G DEM data that was provided in the labs. Notice the different size of the two options for retrieving DEMs.

Clipping DEMs
Often the size of raster or vector files exceed the extent of the mapping area, resulting in the need to clip them.
In this example, clip the “cdem_dem_92G” dem to the extent of the Prospect Point Lookout tif file.
From the top menu bar choose Raster > Extraction > Clip by Extent
Then choose the Prospect Point Lookout image as the extent and save the file appropriately

In some cases this would be the time to reproject (warp) your raster layers (tif image and DEM)
Creating 3D map
QGIS has a strong ability to display 3D (if your computer is having difficulty then you may need to try this one in the GIS Lab).
Choose View from the top menu. New 3D map view
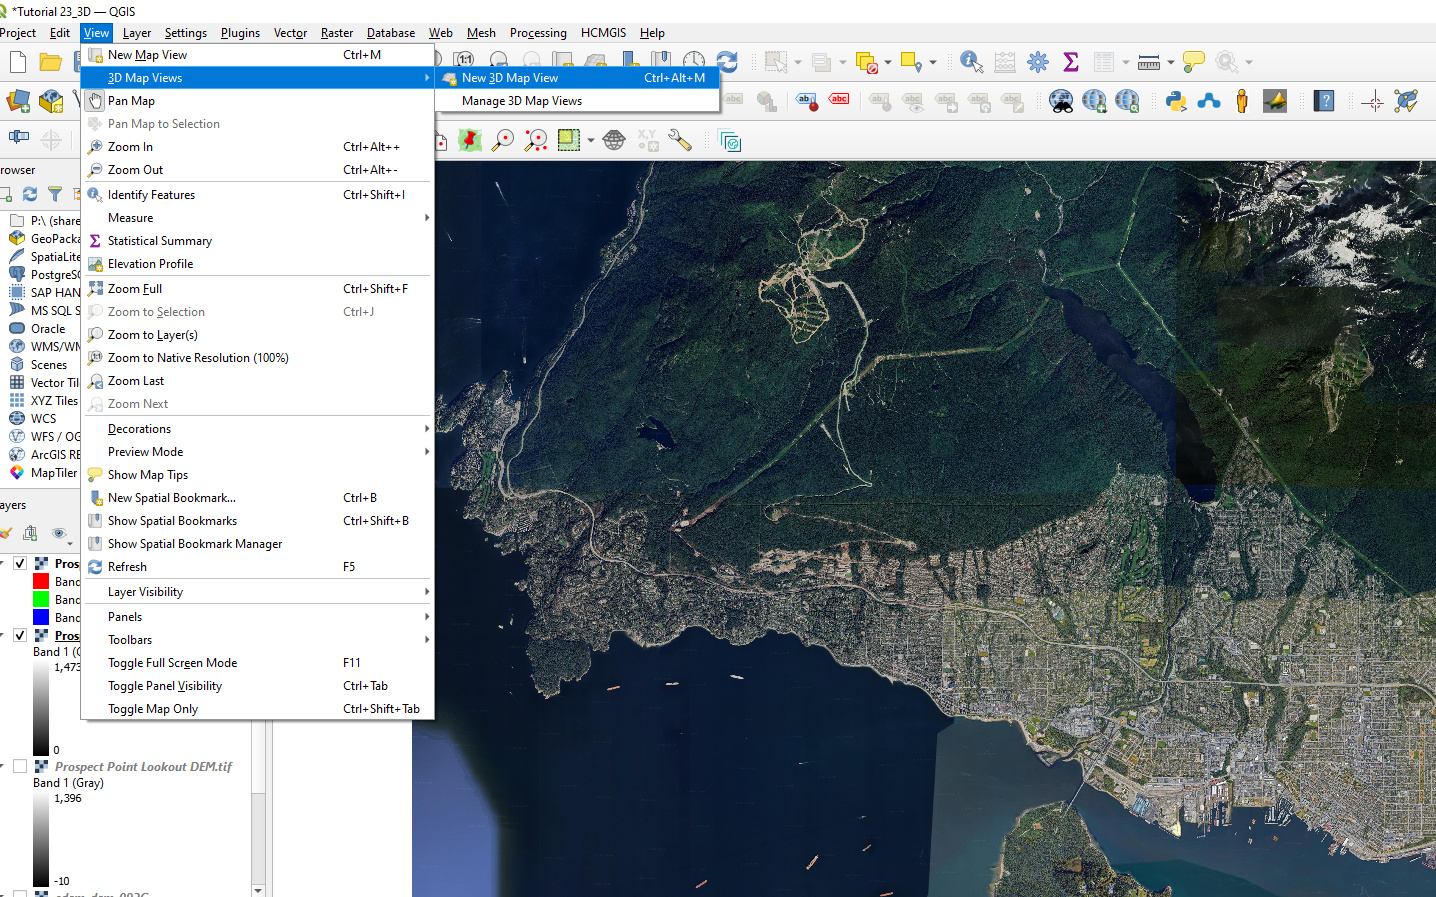
Enlarge the 3D Map box so it is manageable, and choose the little wrench icon, followed by configure.

In the 3D Configuration box you want to select “Terrain”,
Type = DEM (Raster Layer), Elevation = Dem (of your choice), Vertical scale = 2.5, Tile resolution = 75 px – Ok
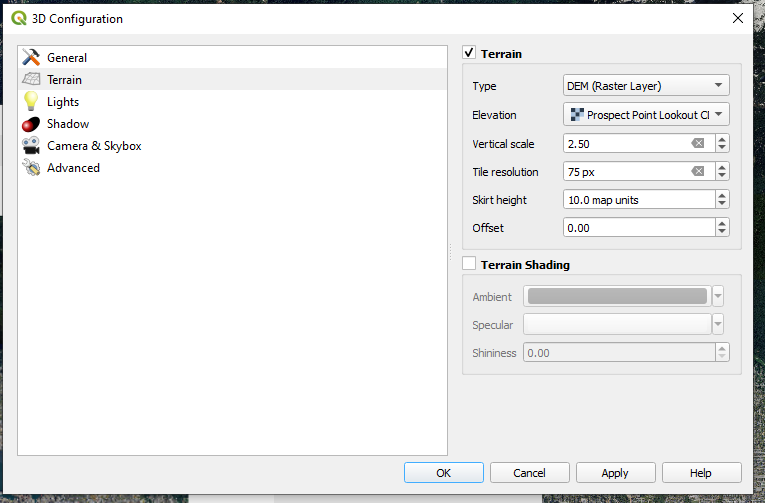
This should be the result
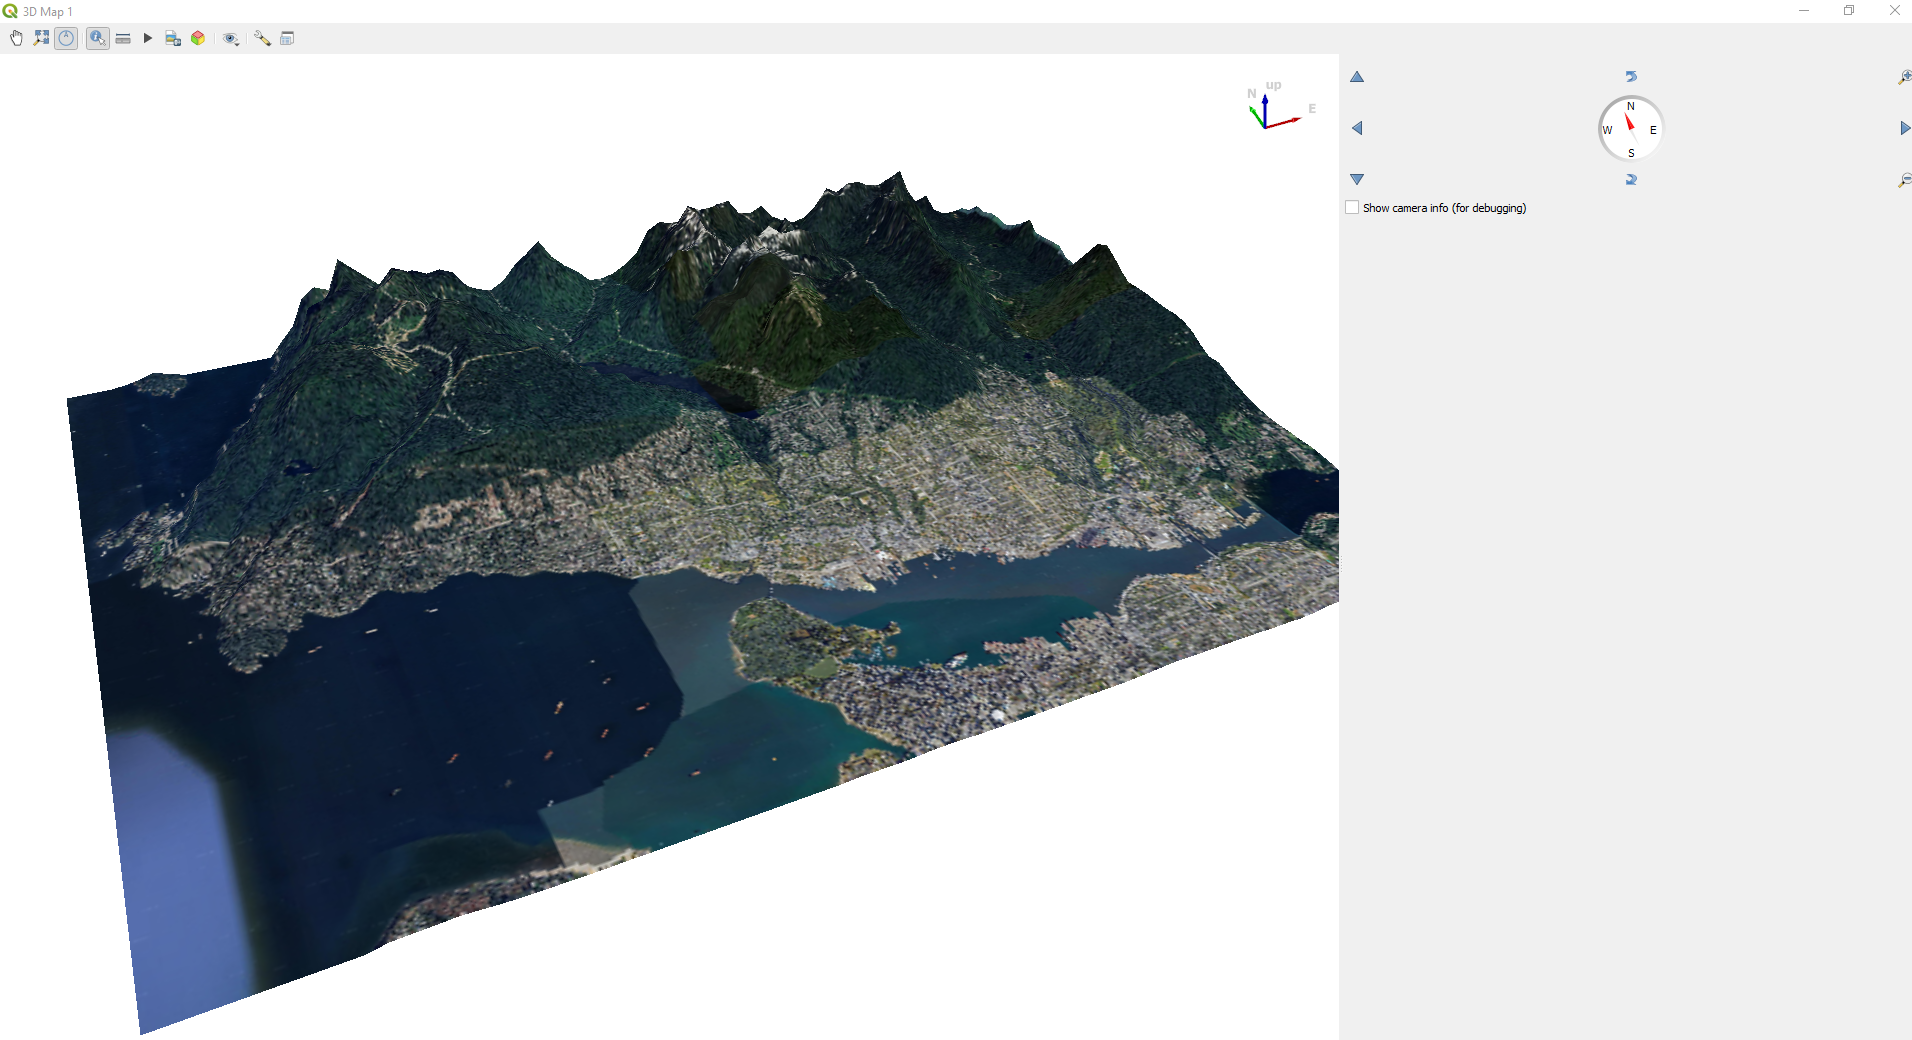
This type of 3D map is useful as an inset map or as an accompanying map.
If you open Print Layout you will find that you can create a 3D map

You can improve the visual appeal of your 3D map by adding more layers to the map in the 2D environment of QGIS.
For example: using the following link Tutorial 23 , you have access to some addiitonal vector layers that were created using a bounding box and the clip function. If you download these geogpackages, below is a video on the benefits of geopackages WATCH THIS!!!!
After you have downloaded and opened the vector files (geopackages) in QGIS do the following.
- Land Usse NV > Properties > Symbology > Categorized > Value = LANDTYPE, Color ramp = spectral, opacity = 50%
- Creeks > Properties > Symbology > Color = HTML notation = #12a9f4
- Ocean > Properties > Symbology > Color = HTML notation = #12a9f4, Opacity = 65%
- Lakes > Properties > Symbology > Color = HTML notation = #12a9f4. Opacity 100%
If you return to the instructions above, and create a new 3D map view you can configure the 3D map to include your new additional layer. I used a verticcal scale exaggeration of 2.00x (but you choose what you think looks best).

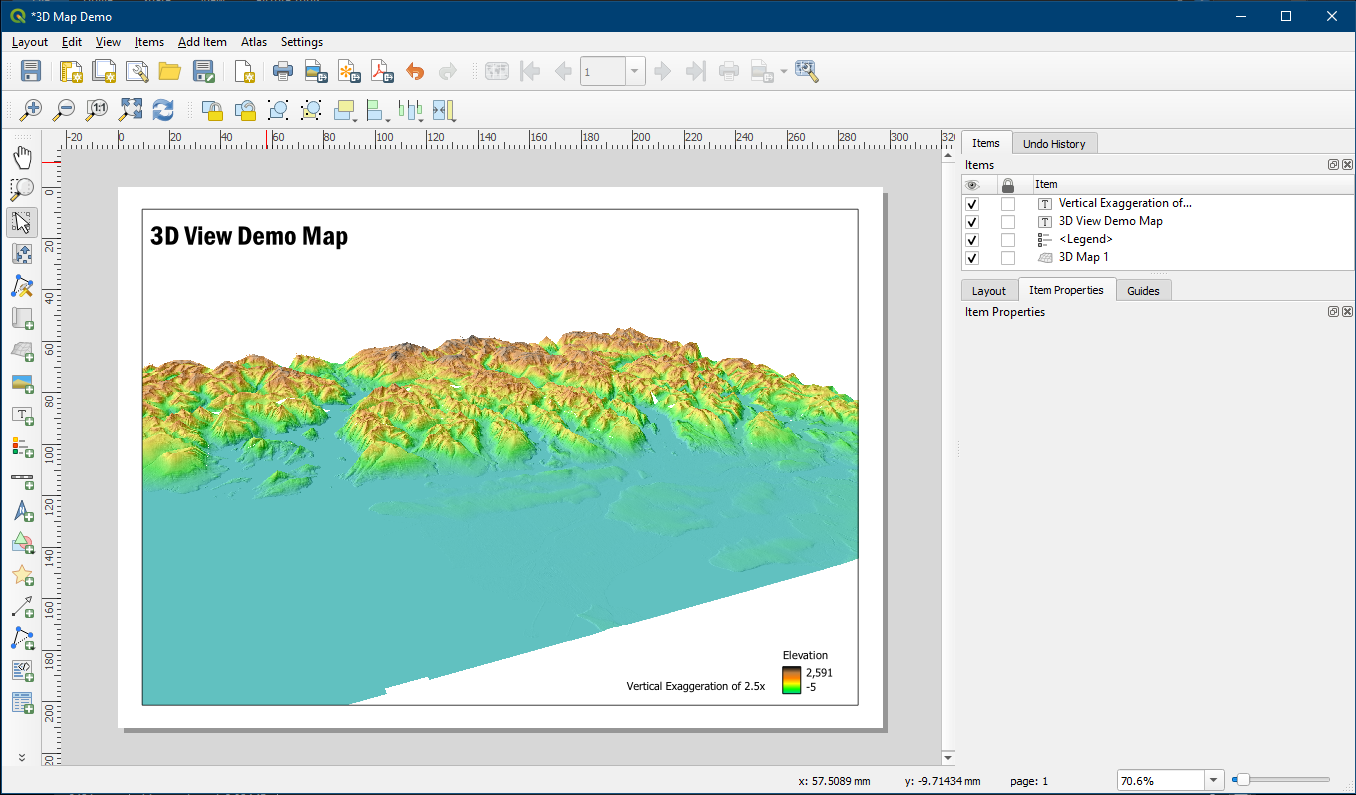
Returning to the Print Layout,
You can add a Title, and a legend to the 3D map; however, the North Arrow, and Scale Bar will not be true to the perspective of the image.
Below are a few examples from different perspectives.

