GIS Systems work with many different types of data. Vector data is stored as a series of X, Y coordinate pairs inside the computer’s memory. Vector data is used to represent points, lines and areas. The illustration below shows different types of vector data being viewed in a GIS application. In the tutorials that follow we will be exploring vector data in more detail.
Vector data is used to represent points (e.g. towns), lines (e.g. rivers) and polygons (e.g. municipal boundaries).
QGIS allows for the displaying numerous types of vector data formats include ESRI formats (Shapefile, Geodatabase…), MapInfo and MicroStation file formats, AutoCAD DWG/DXF, GeoPackage, GeoJSON, GRASS, GPX, KML, Comma Separated Values, and many more… Read the complete list of OGR vector supported formats.
There are several manners to open vector layers in QGIS.
** remember that Vector files are, for the most part, synonymous with Shapefiles
To open vector layers in QGIS, one method is to open the Data Source Manager. One way of opening the Data Source Manager is to navigate Menu > Layer > Add Layer > Add Vector Layer.
- Click Menu > Layer > Add Layer > Add Vector Layer…
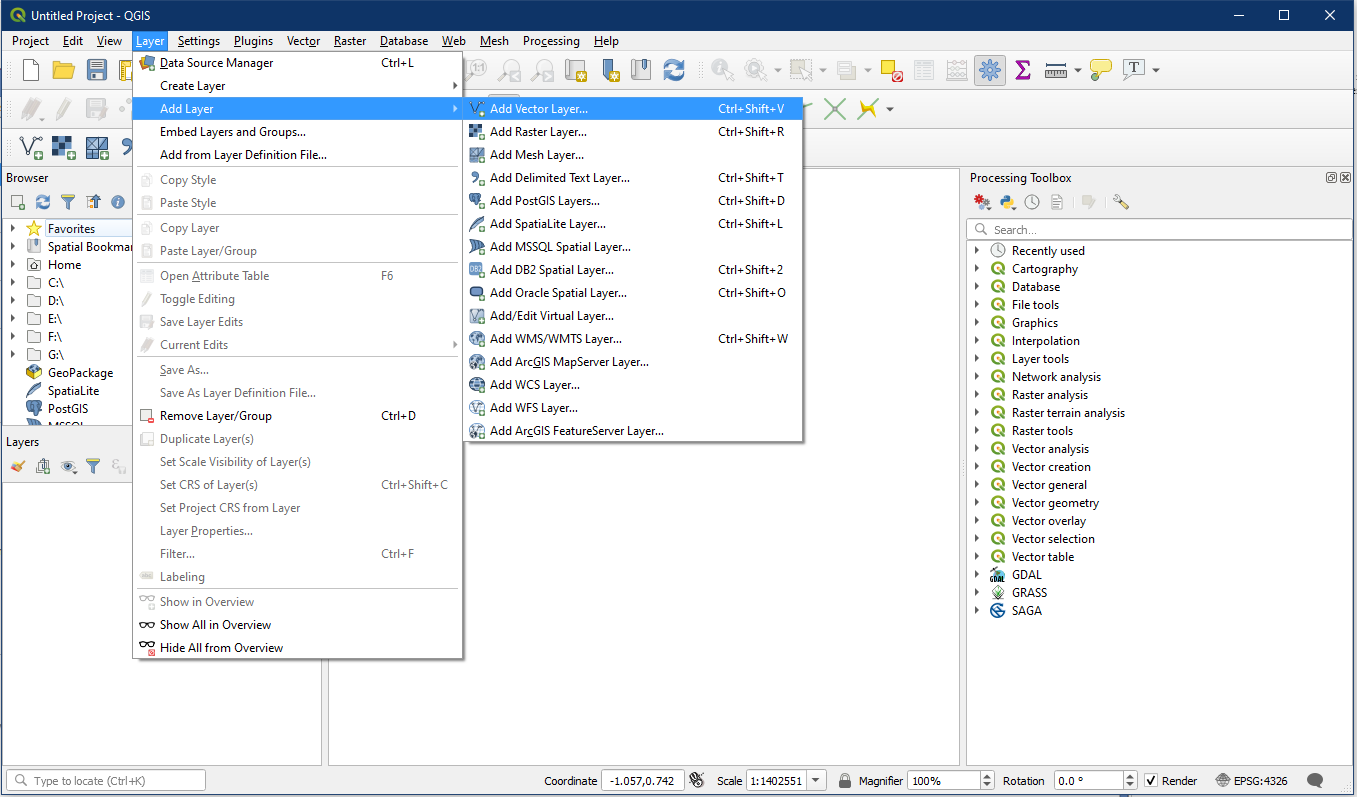
The Add vector layer window will pop up, choose the File option from the Source Type area
From the Source area use the “…” button to locate your dataset and the appropriate file(s). In the image below you will see we chose the .shp file or shapefiles. The other files are associated files and may not be displayed when chosen. This is a link to explore opening different QGIS Supported file types, we will explore them later if you wish to wait.

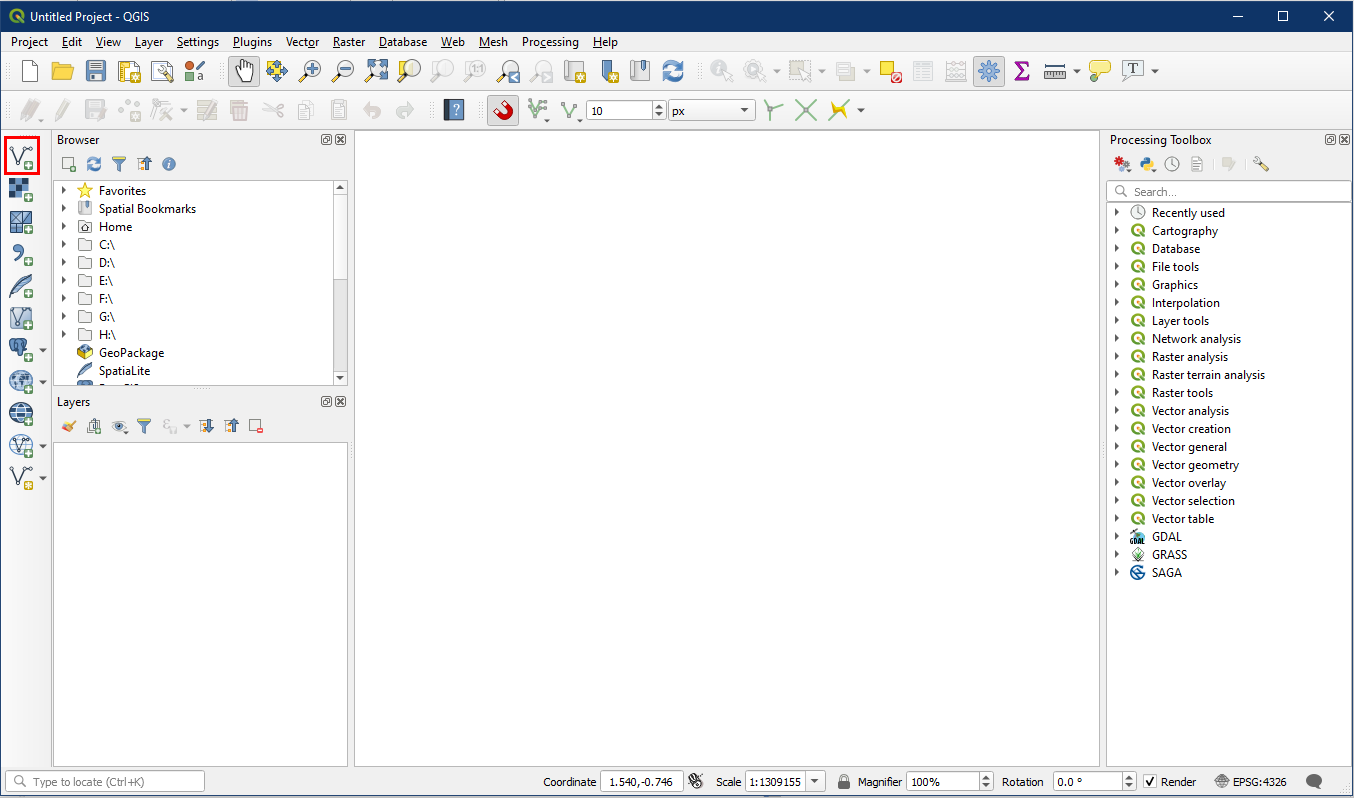
Another method is to click the Add Vector Layer toolbar button. Clicking this button will bring up the Add vector layer window and the result will be identical to that of above.
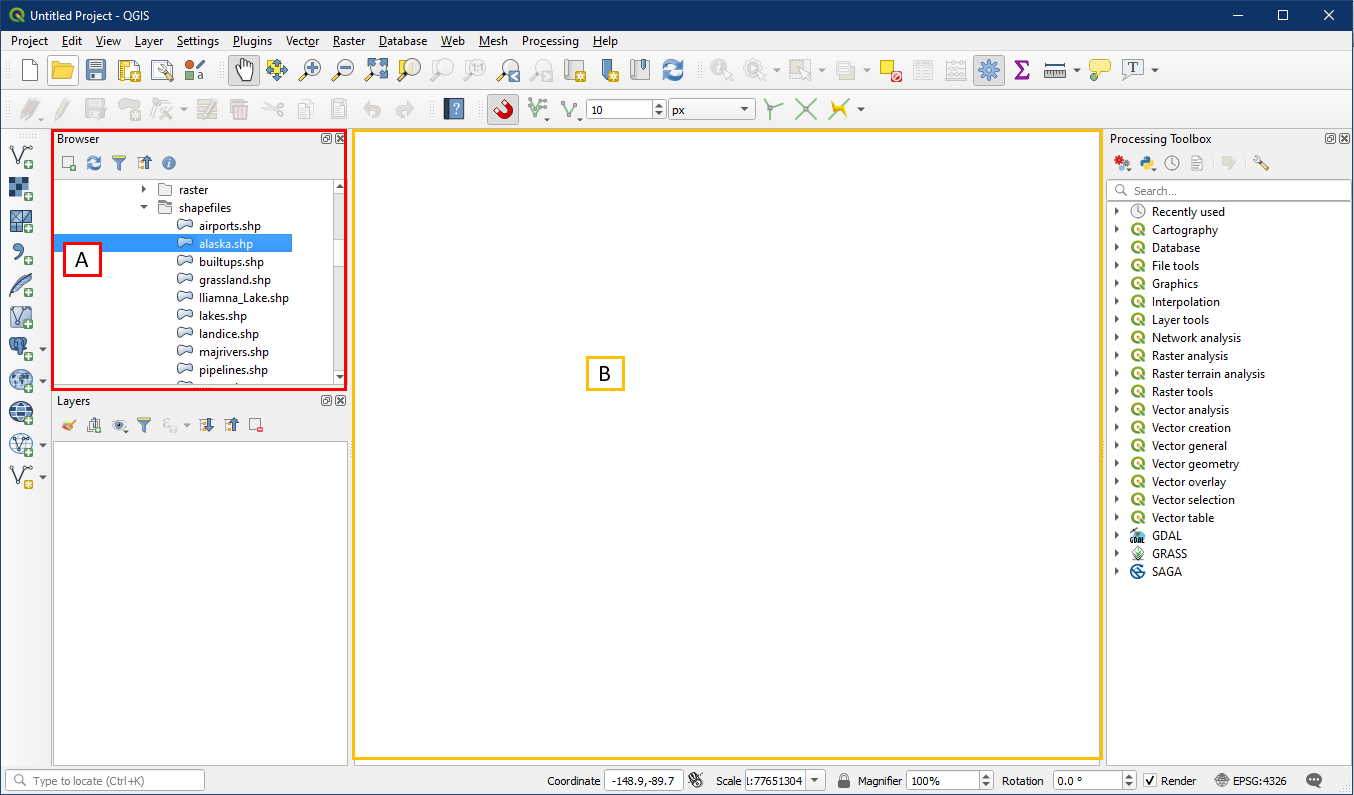
A third and simplest method is to use the Browser Panel to locate the file (A) within a directory that holds your vector data and then drag and drop into the Map Display window (B).
Activity – Display and Edit Vector Layer Properties
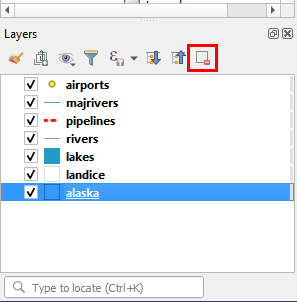
Open QGIS. In the Browser locate the shapefiles folder within Alaska_data (A). Select the following layers listed below from the Browser and drag them onto the map (B) to add the layers to the project. A “Select Transformation” window may appear, you can simply click OK. Notice that the layers will be listed in the Layer panel as well.
Layers to add:
- airports
- alaska
- lakes
- landice
- majrivers
- pipelines
- rivers

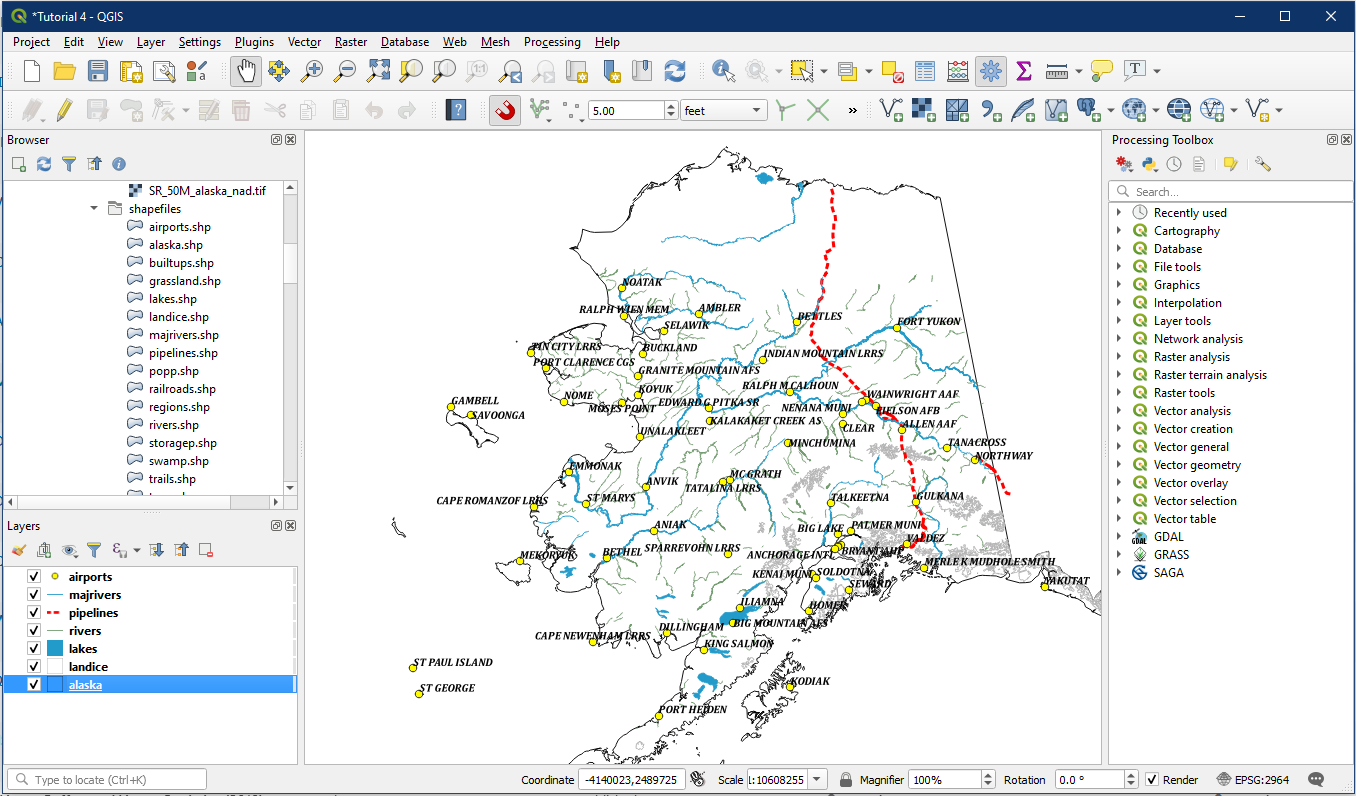
You should notice that you now have all three types of vector data in the map display (point, line, and polygon).
QGIS allows you to edit Layer properties through double-clicking the layer within the Layers Panel or through Menu Bar > Layer > Properties. Within Properties, the Symbology panel is used to change how the feature looks. Change the properties for the airports layer as follows. Under the Symbology panel, first select Single symbol (A), then in the box below (B) it will say Marker/Line/Fill depending on whether the layer is point, line, or polygon.

Now click Simple marker/line/fill (C), and a more detailed set of properties will show up below (D). Clicking on Simple Marker provides us with a much better set of customizations than clicking on Marker.
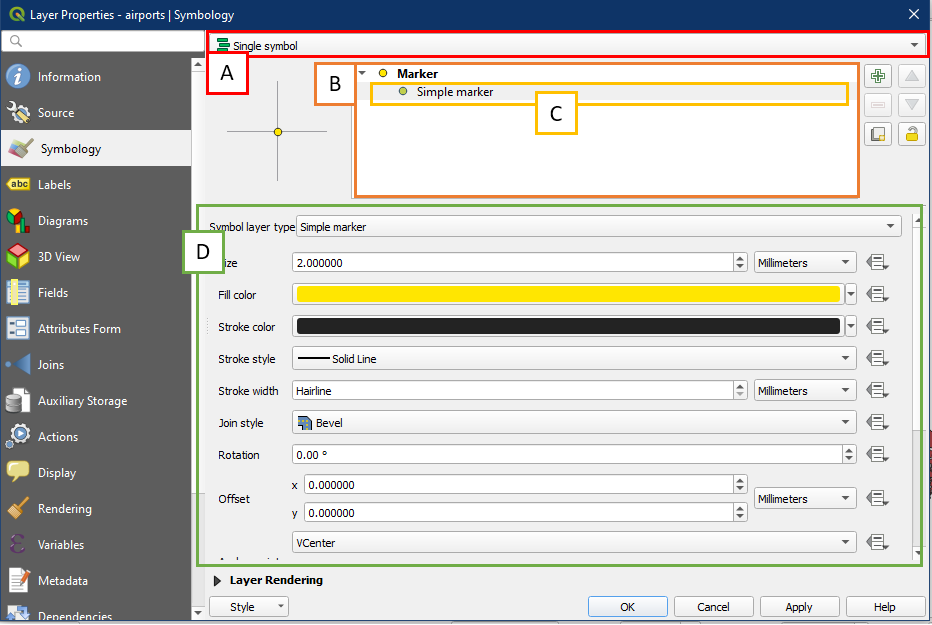
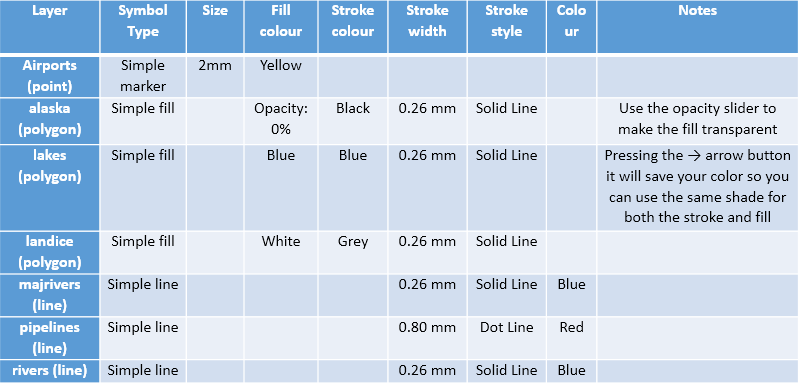
Adjust the properties as required based on the details below. Note that not all properties are applicable for each different layer type so some boxes are blank. For example points and polygons have separate fill and stroke colours, while lines only have one colour since there is no fill.
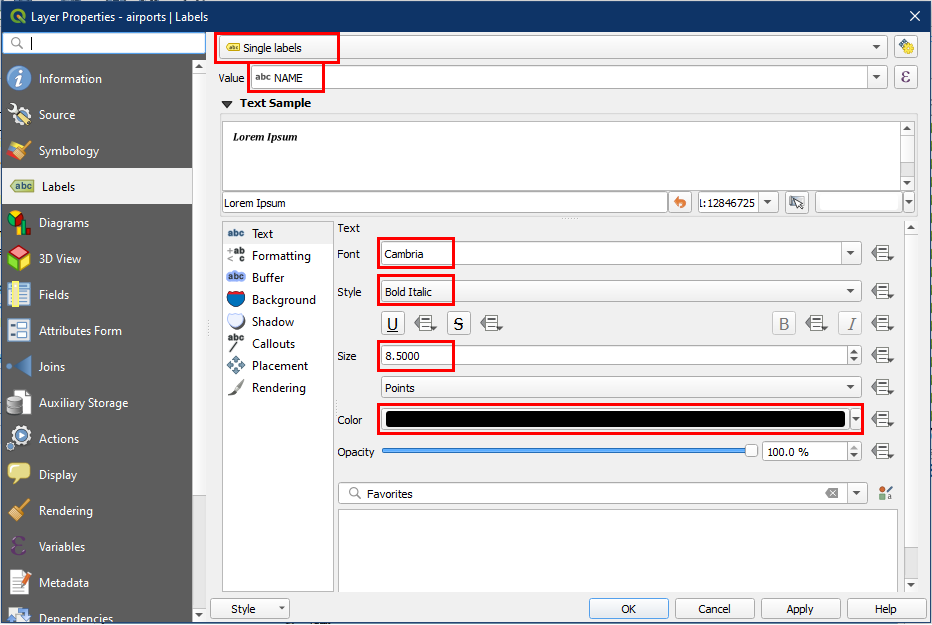
For the airport layer, we also want to add labels. To do this, go to the layer properties again, but this time choose the Labels panel. Adjust the label properties as shown below.
Your map should now look similar to this. For optimal visibility, drag the layers into order as shown in the screenshot below, with airports on top and alaska on the bottom. The sequential ordering of layers is a skill and something you will want to consider in the future. But in general, layers are best ordered based on the data type listed below in order to maximize visibility.
- Points
- Lines
- Polygons
- Rasters (covered in next tutorial)
To remove layers from the Layers Panel, highlight the layer and click the Remove Layer/Group button from the Layer panel.
Once you have completed this activity, you can save the project as Tutorial_4.
QGIS saves your work as projects and these are accessible regardless of where they are saved, as long as the data is in the same directory folder.